HGF Trading Predictions
1 Day Prediction
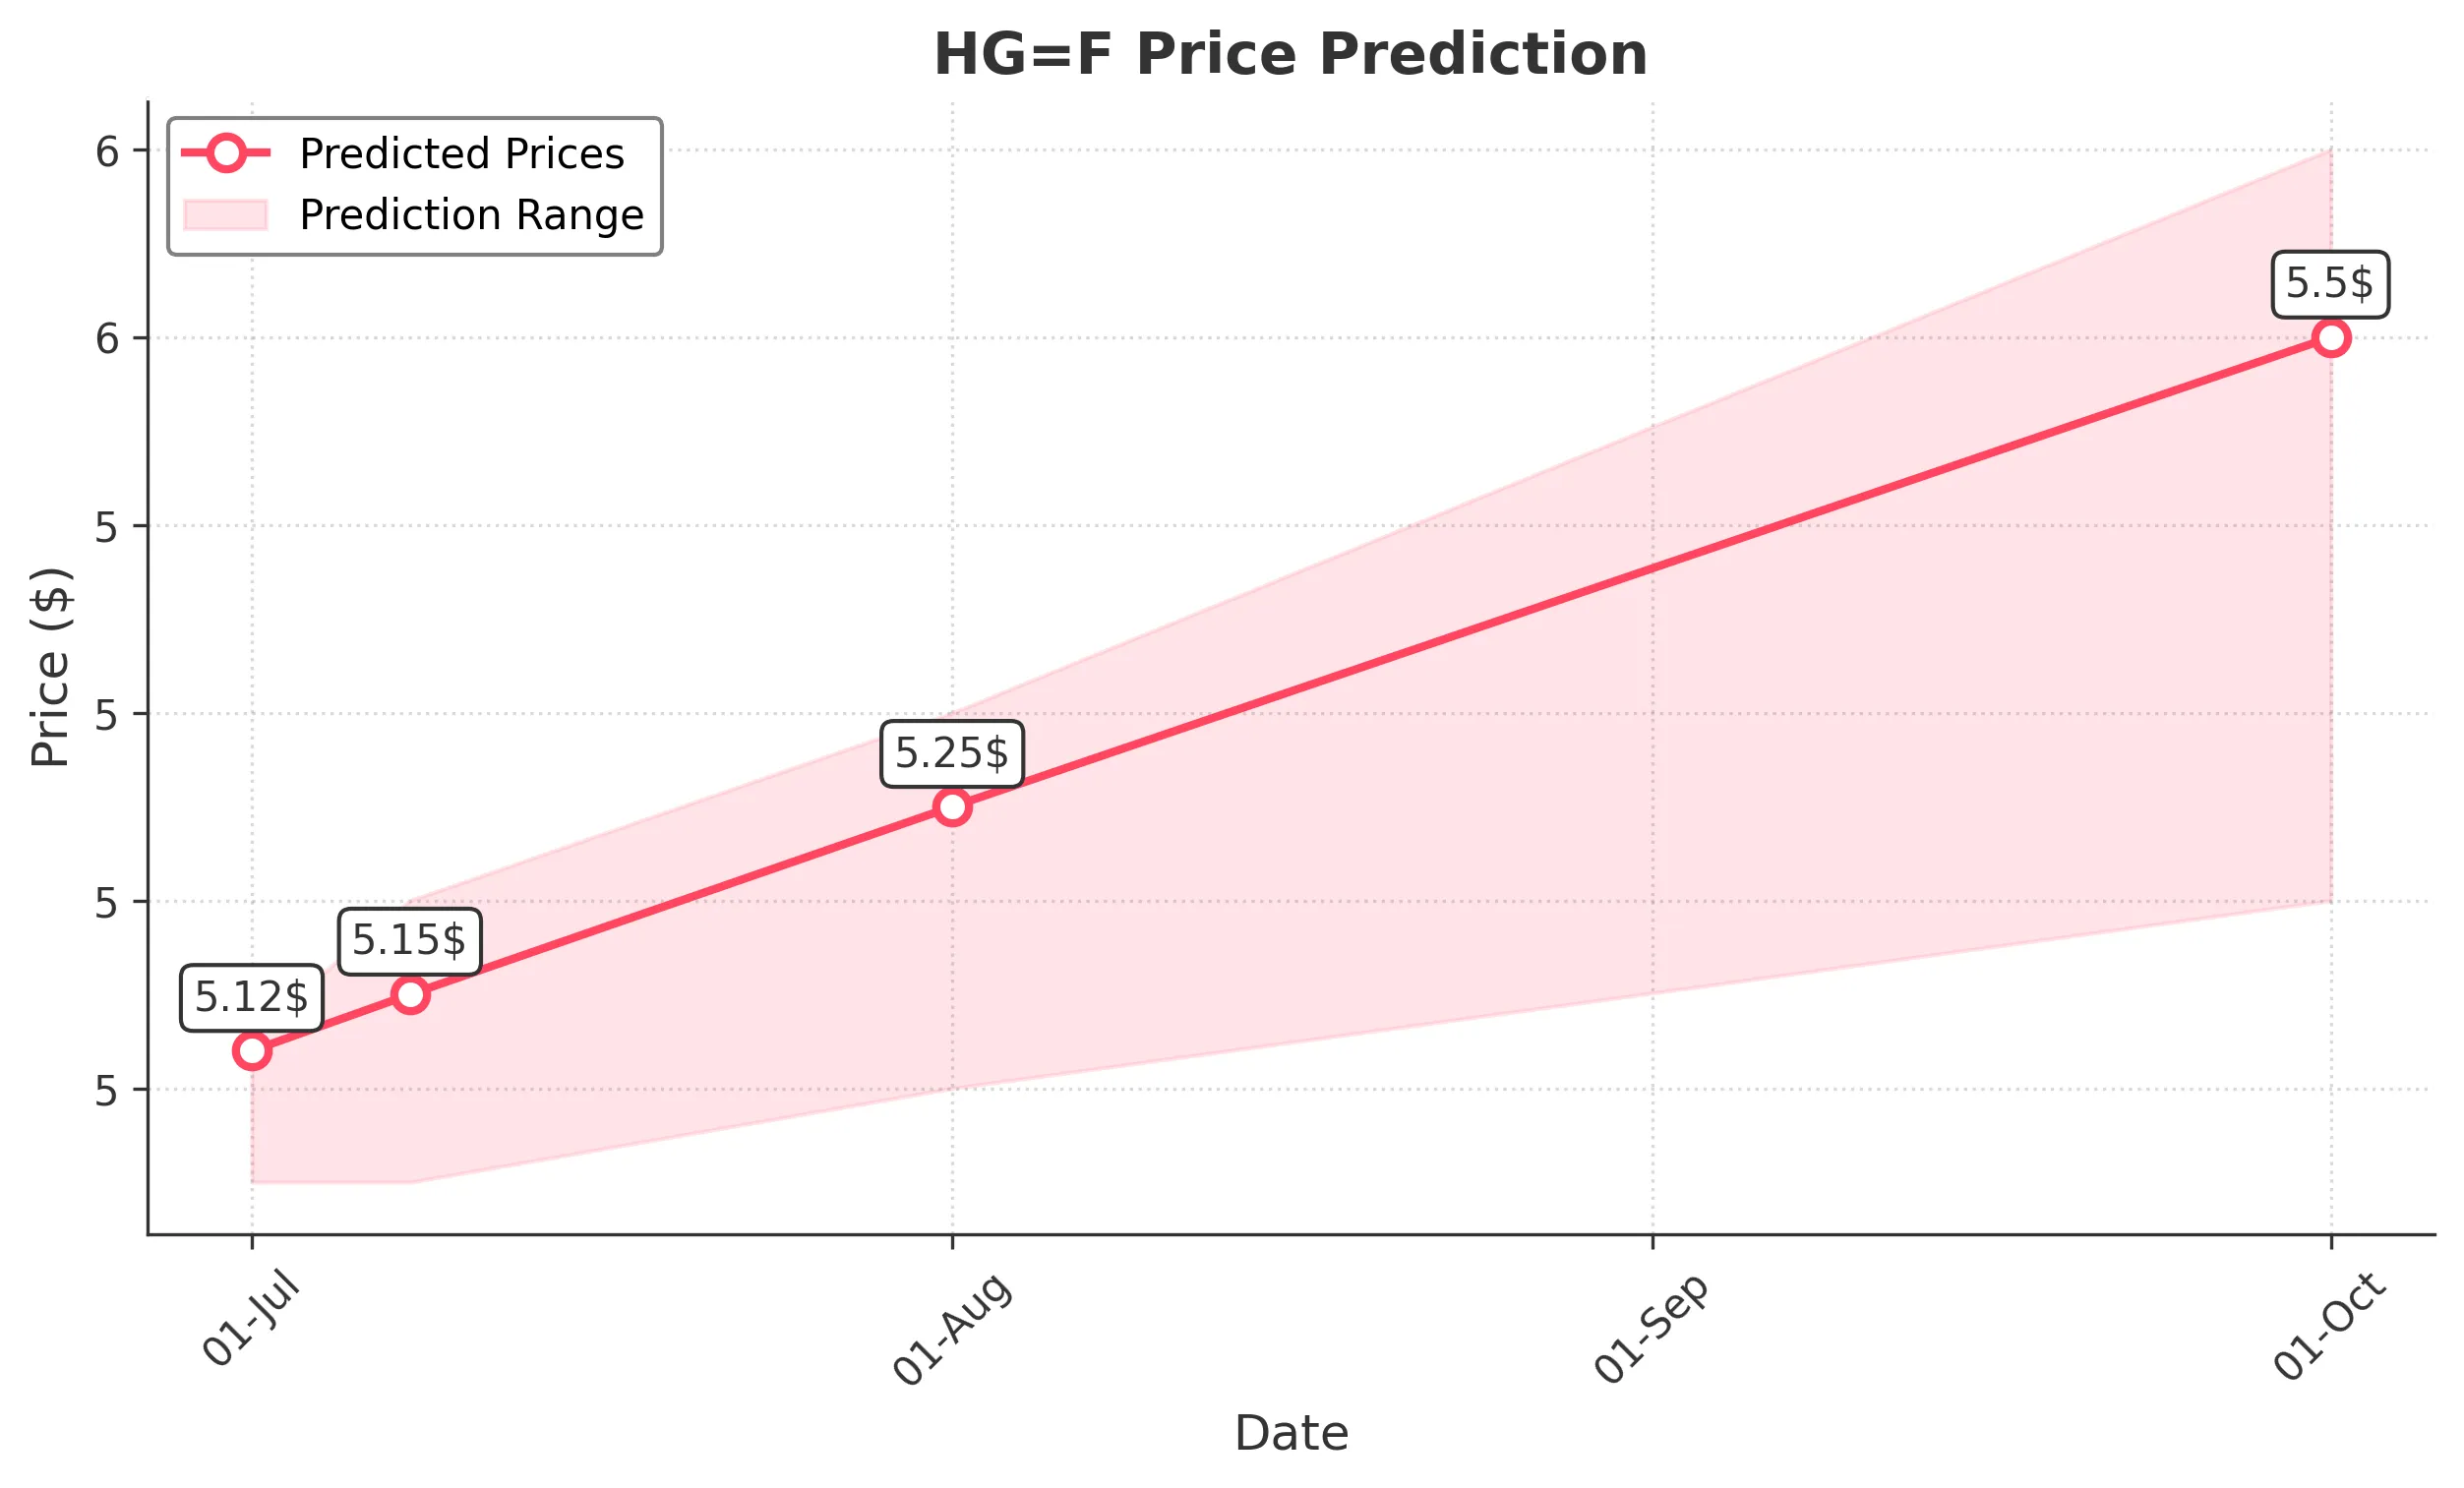
Target: July 1, 2025$5.12
$5.1065
$5.13
$5.05
Description
The stock shows bullish momentum with a recent close above the 50-day moving average. RSI is approaching overbought territory, indicating potential upward pressure. Volume has been increasing, suggesting strong buying interest.
Analysis
Over the past 3 months, HG=F has shown a bullish trend, with significant support at 4.8000 and resistance around 5.1300. The MACD indicates upward momentum, while Bollinger Bands suggest volatility. Recent volume spikes indicate strong interest.
Confidence Level
Potential Risks
Potential market corrections or profit-taking could impact the price.
1 Week Prediction
Target: July 8, 2025$5.15
$5.12
$5.2
$5.05
Description
The stock is expected to maintain its bullish trend, supported by strong buying volume and positive market sentiment. However, the RSI indicates overbought conditions, which may lead to short-term pullbacks.
Analysis
The stock has been trending upward, with key support at 5.0000 and resistance at 5.2000. The MACD remains positive, and the ATR indicates moderate volatility. Recent candlestick patterns suggest bullish continuation.
Confidence Level
Potential Risks
Market volatility and external economic factors could lead to unexpected price movements.
1 Month Prediction
Target: August 1, 2025$5.25
$5.15
$5.3
$5.1
Description
The stock is likely to continue its upward trajectory, supported by strong fundamentals and positive market sentiment. However, the RSI may indicate overbought conditions, suggesting potential corrections.
Analysis
The stock has shown a consistent bullish trend, with significant support at 5.0000. The MACD is bullish, and the Bollinger Bands indicate potential for upward movement. Volume trends suggest sustained interest.
Confidence Level
Potential Risks
Economic data releases and geopolitical events could impact market sentiment and stock performance.
3 Months Prediction
Target: October 1, 2025$5.5
$5.25
$5.6
$5.2
Description
Long-term bullish sentiment is expected, driven by strong fundamentals and market recovery. However, potential economic downturns could pose risks to sustained growth.
Analysis
The stock has shown a strong upward trend, with key support at 5.2000 and resistance at 5.6000. The MACD indicates bullish momentum, while the ATR suggests increasing volatility. External economic factors may influence future performance.
Confidence Level
Potential Risks
Market corrections and economic uncertainties could lead to volatility and price declines.