HGF Trading Predictions
1 Day Prediction
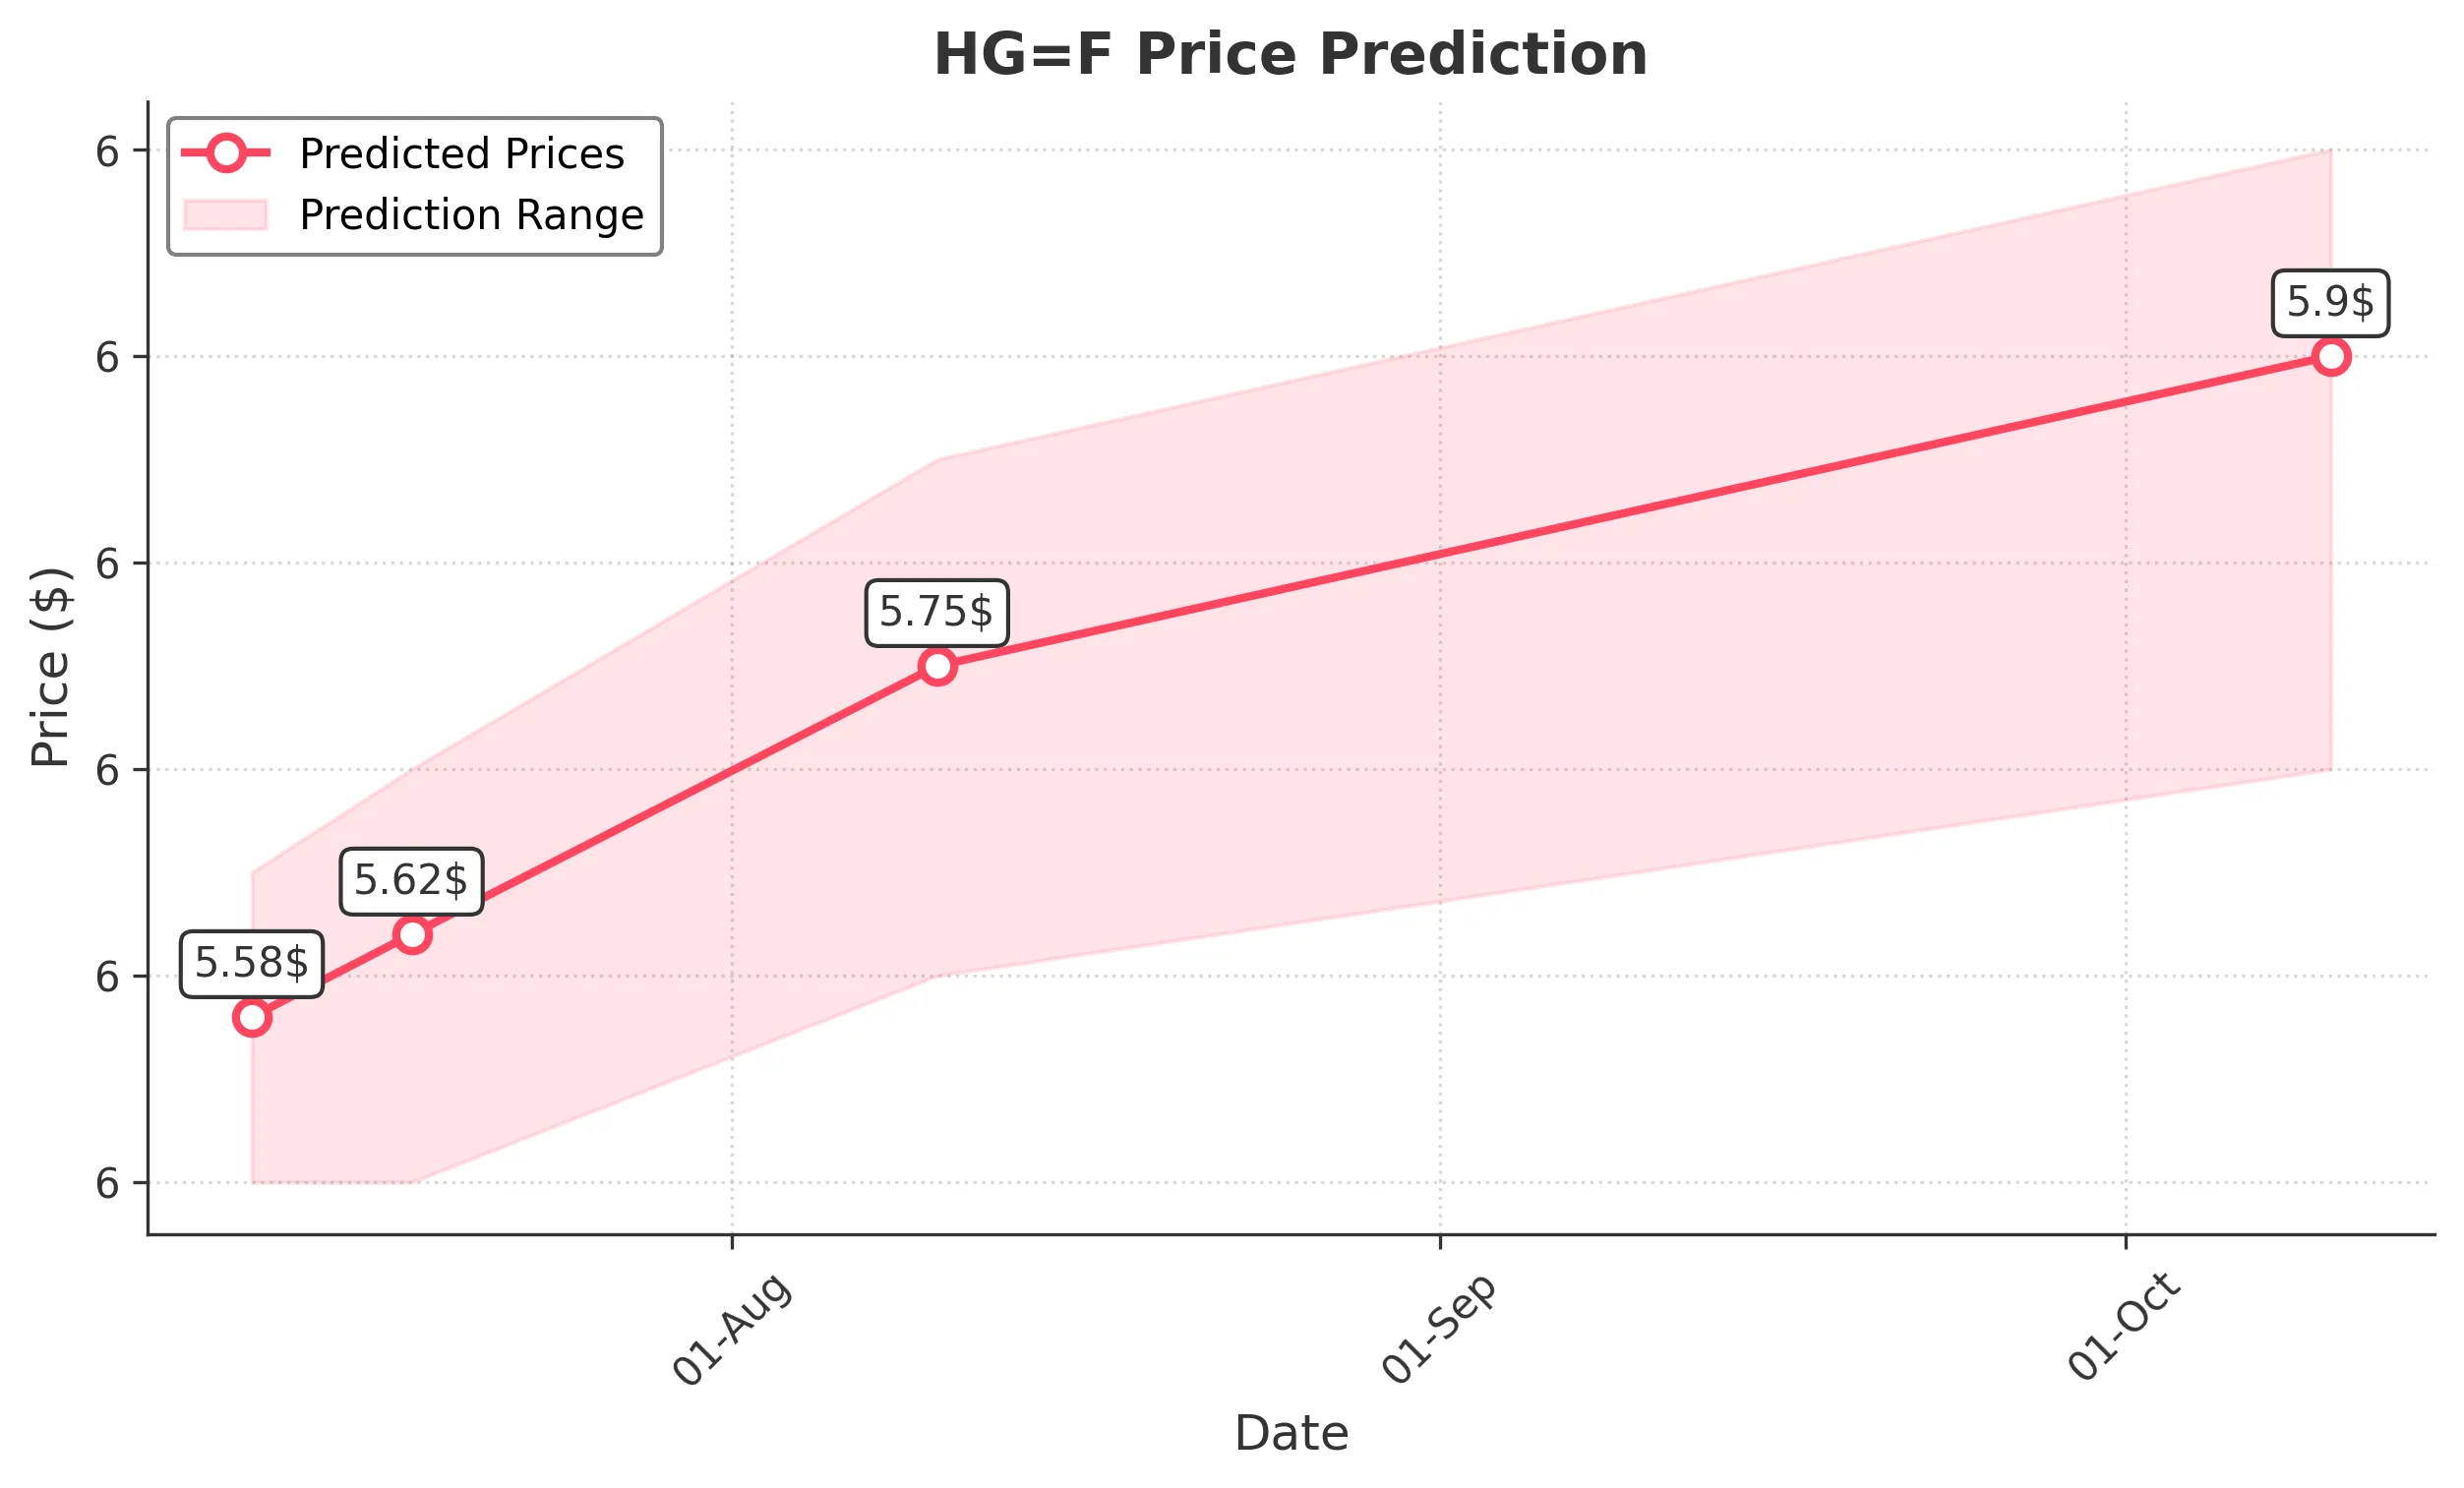
Target: July 11, 2025$5.58
$5.6
$5.65
$5.5
Description
The stock shows a bullish trend with a recent upward movement. The RSI is approaching overbought levels, indicating potential for a pullback. However, the MACD remains positive, suggesting continued momentum. Expect slight volatility due to market sentiment.
Analysis
Over the past 3 months, HG=F has shown a bullish trend, with significant support at 5.0000 and resistance around 5.7000. The recent price action indicates strong buying interest, but RSI nearing overbought levels suggests caution. Volume spikes on upward days indicate strong interest.
Confidence Level
Potential Risks
Potential for a reversal if market sentiment shifts or if external news impacts trading.
1 Week Prediction
Target: July 18, 2025$5.62
$5.58
$5.7
$5.5
Description
The stock is expected to maintain its upward trajectory, supported by recent bullish candlestick patterns. The MACD remains positive, and the Bollinger Bands suggest potential for a breakout. However, watch for any bearish divergence in RSI.
Analysis
The stock has been in a bullish phase, with key support at 5.5000. The recent price action shows strong buying pressure, but the RSI indicates potential overbought conditions. Volume analysis shows increased activity, suggesting strong interest from traders.
Confidence Level
Potential Risks
Market volatility and external economic factors could impact the stock's performance.
1 Month Prediction
Target: August 10, 2025$5.75
$5.62
$5.85
$5.6
Description
The stock is likely to continue its upward trend, supported by strong fundamentals and positive market sentiment. The MACD indicates bullish momentum, while the RSI may stabilize after a brief pullback. Watch for any significant news that could affect prices.
Analysis
In the last three months, HG=F has shown a clear bullish trend with significant resistance at 5.7000. The stock's performance has been supported by strong volume on upward days, but caution is warranted as the RSI approaches overbought territory.
Confidence Level
Potential Risks
Unforeseen macroeconomic events or shifts in market sentiment could lead to volatility.
3 Months Prediction
Target: October 10, 2025$5.9
$5.8
$6
$5.7
Description
The stock is expected to reach new highs as bullish sentiment continues. The MACD remains strong, and the stock may break through resistance levels. However, watch for potential corrections as the RSI may indicate overbought conditions.
Analysis
The overall trend for HG=F has been bullish, with key support at 5.5000 and resistance at 5.7000. The stock has shown strong buying interest, but the potential for volatility remains due to external factors. The market sentiment is generally positive, but caution is advised.
Confidence Level
Potential Risks
Market corrections or negative news could impact the stock's upward trajectory.