HGF Trading Predictions
1 Day Prediction
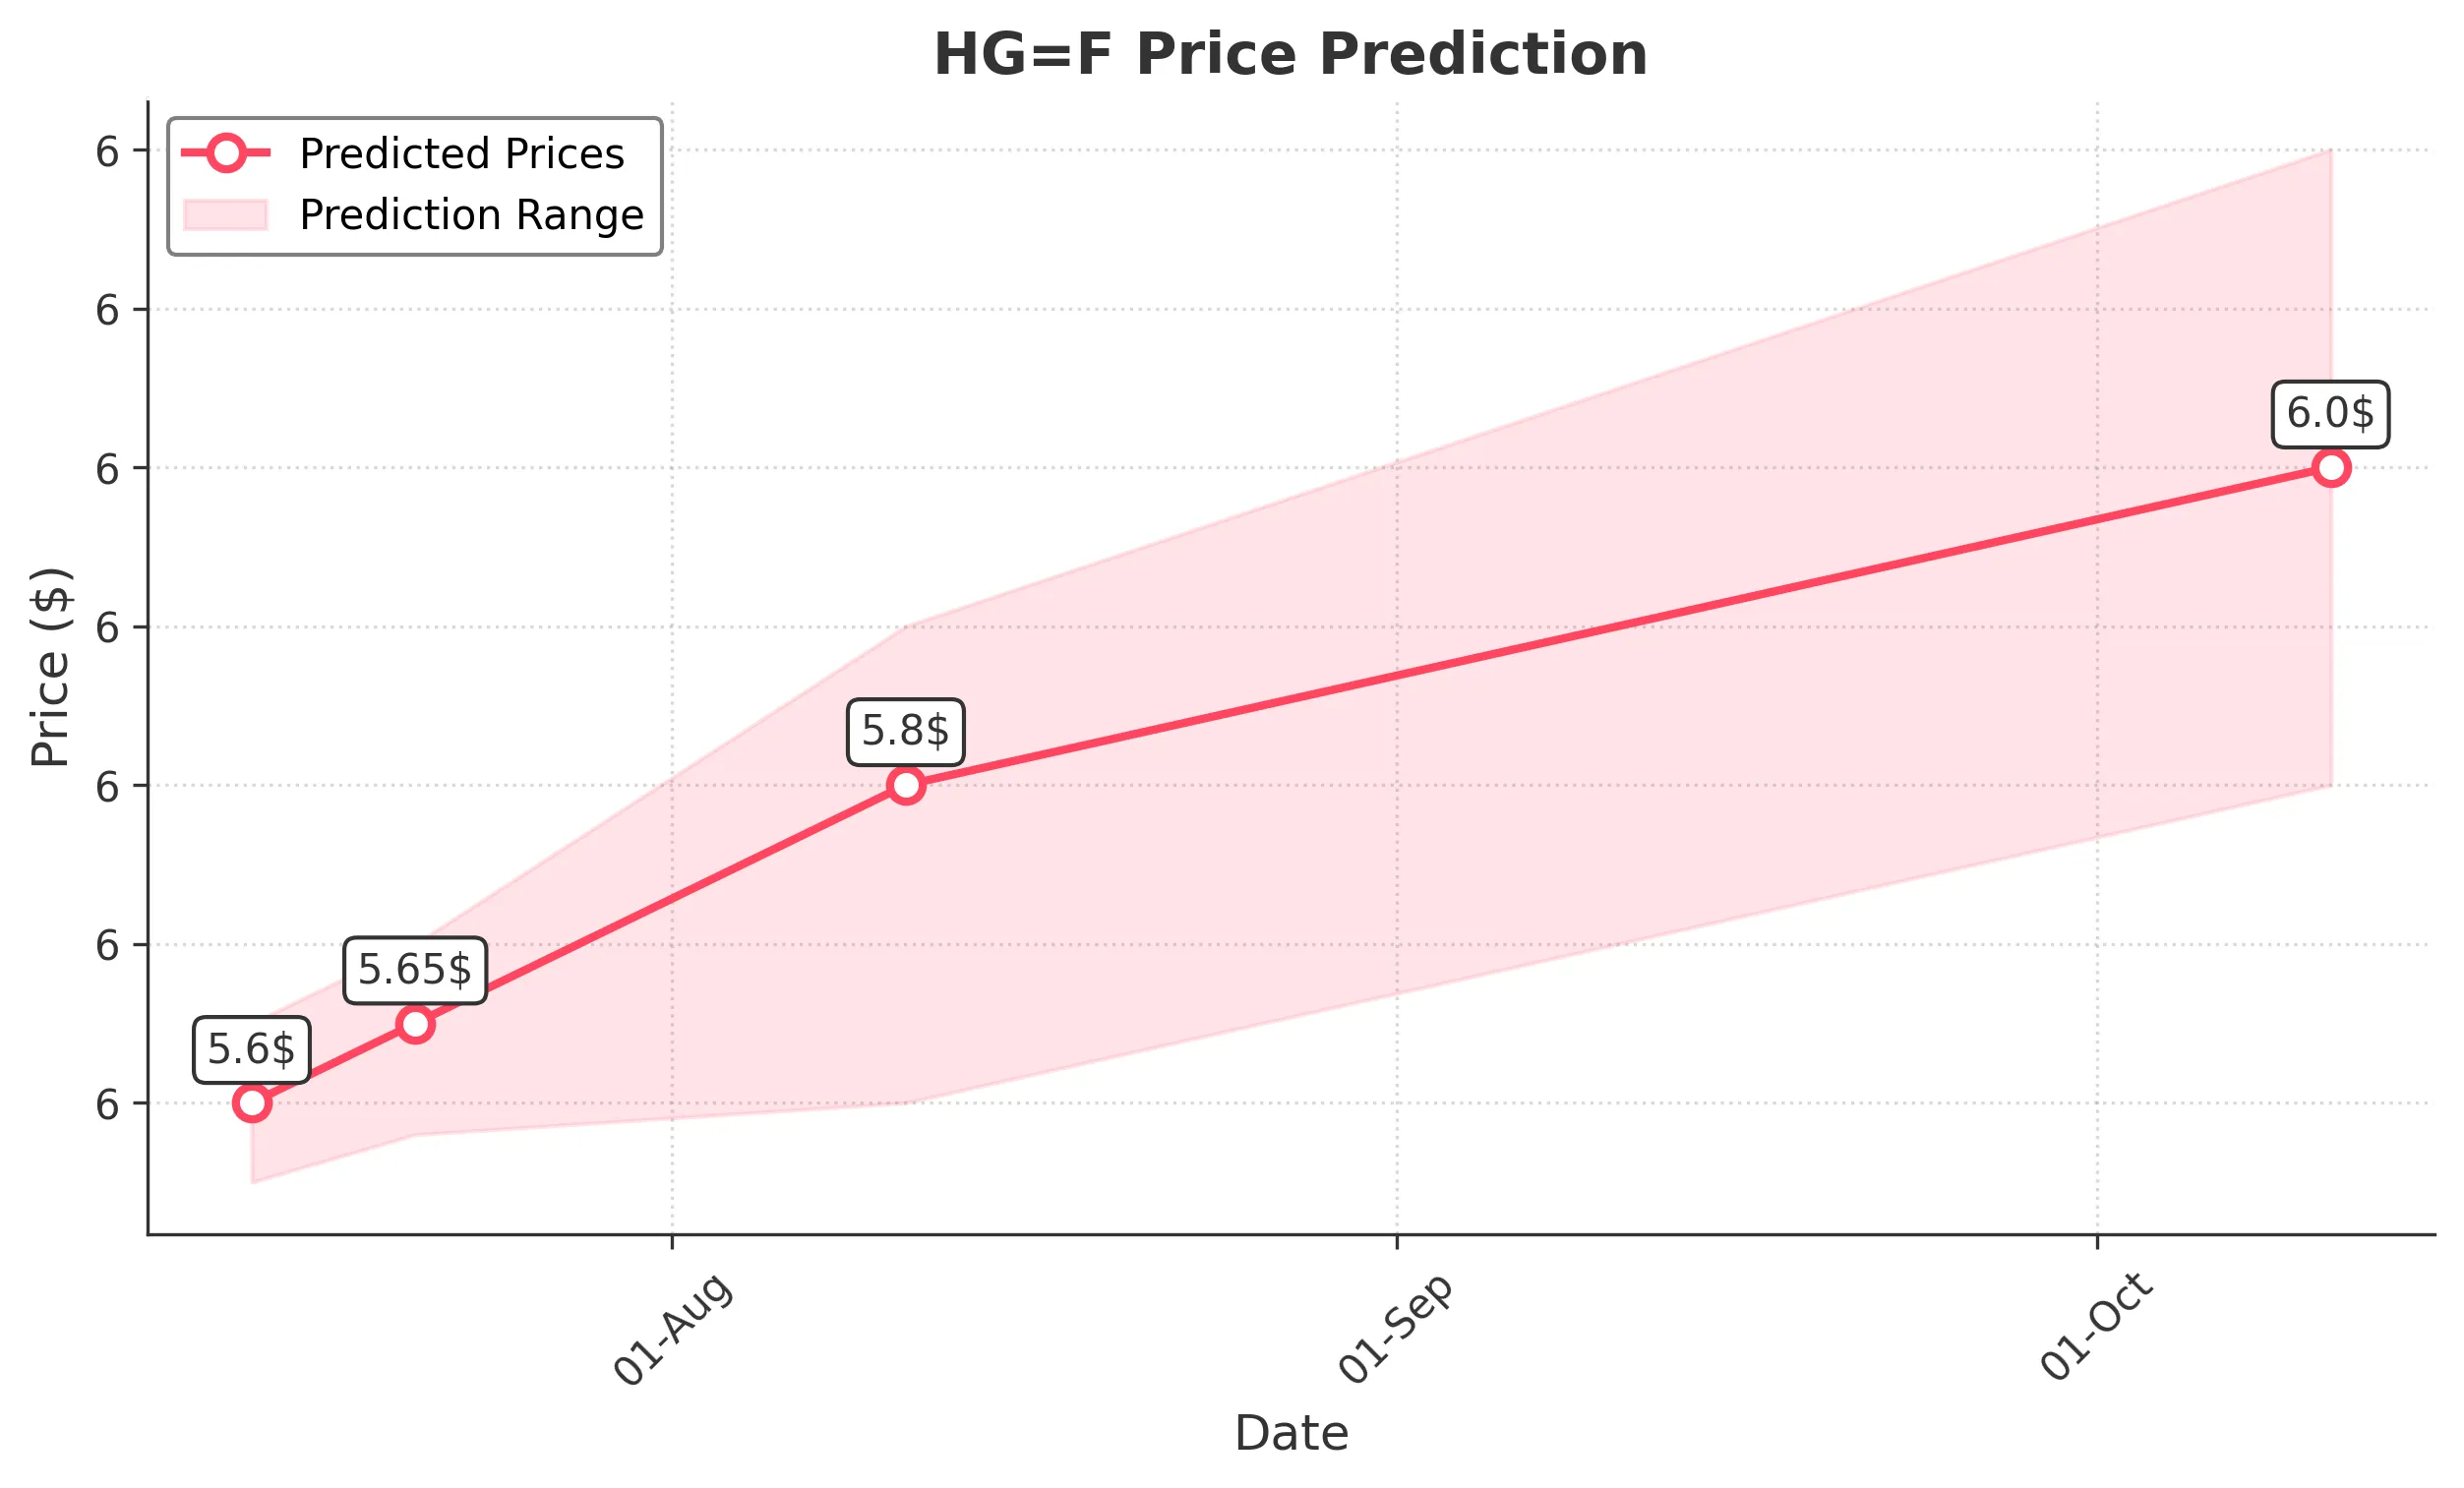
Target: July 14, 2025$5.6
$5.59
$5.65
$5.55
Description
The stock shows a bullish trend with a recent upward movement. The RSI is approaching overbought levels, indicating potential for a pullback. However, the MACD remains positive, suggesting continued upward momentum. Volume has been increasing, supporting the price rise.
Analysis
Over the past 3 months, HG=F has shown a bullish trend, with significant support at 5.0000 and resistance around 5.7000. The recent price action indicates strong buying interest, but the RSI nearing overbought levels suggests caution. Volume patterns indicate increased activity, particularly on up days.
Confidence Level
Potential Risks
Potential market volatility and profit-taking could lead to a price correction.
1 Week Prediction
Target: July 21, 2025$5.65
$5.6
$5.7
$5.58
Description
The stock is expected to maintain its bullish trend, supported by strong volume and positive MACD. However, the RSI indicates potential overbought conditions, which may lead to short-term corrections. Watch for resistance at 5.7000.
Analysis
The stock has been on an upward trajectory, with key support at 5.5000. The recent price action shows bullish candlestick patterns, indicating strong buying pressure. However, the market's overall sentiment and macroeconomic conditions could introduce volatility.
Confidence Level
Potential Risks
Market sentiment could shift due to external economic factors, impacting price stability.
1 Month Prediction
Target: August 11, 2025$5.8
$5.7
$5.9
$5.6
Description
The stock is likely to continue its upward trend, driven by strong fundamentals and positive market sentiment. The MACD remains bullish, and the price is above the 50-day moving average, indicating a strong bullish phase.
Analysis
In the last three months, HG=F has shown a clear bullish trend with significant resistance at 5.9000. The stock's performance has been supported by increasing volume and positive technical indicators. However, external factors could introduce uncertainty.
Confidence Level
Potential Risks
Economic data releases and geopolitical events could impact market sentiment and lead to volatility.
3 Months Prediction
Target: October 11, 2025$6
$5.9
$6.2
$5.8
Description
The stock is expected to reach new highs as bullish momentum continues. The long-term trend remains positive, supported by strong fundamentals. However, watch for potential corrections as the RSI approaches overbought territory.
Analysis
The stock has shown a strong bullish trend over the past three months, with key support at 5.5000 and resistance at 6.2000. The MACD and moving averages indicate a strong upward trend, but potential market corrections could occur due to overbought conditions.
Confidence Level
Potential Risks
Long-term predictions are subject to market fluctuations and unforeseen economic events that could alter the trend.