HGF Trading Predictions
1 Day Prediction
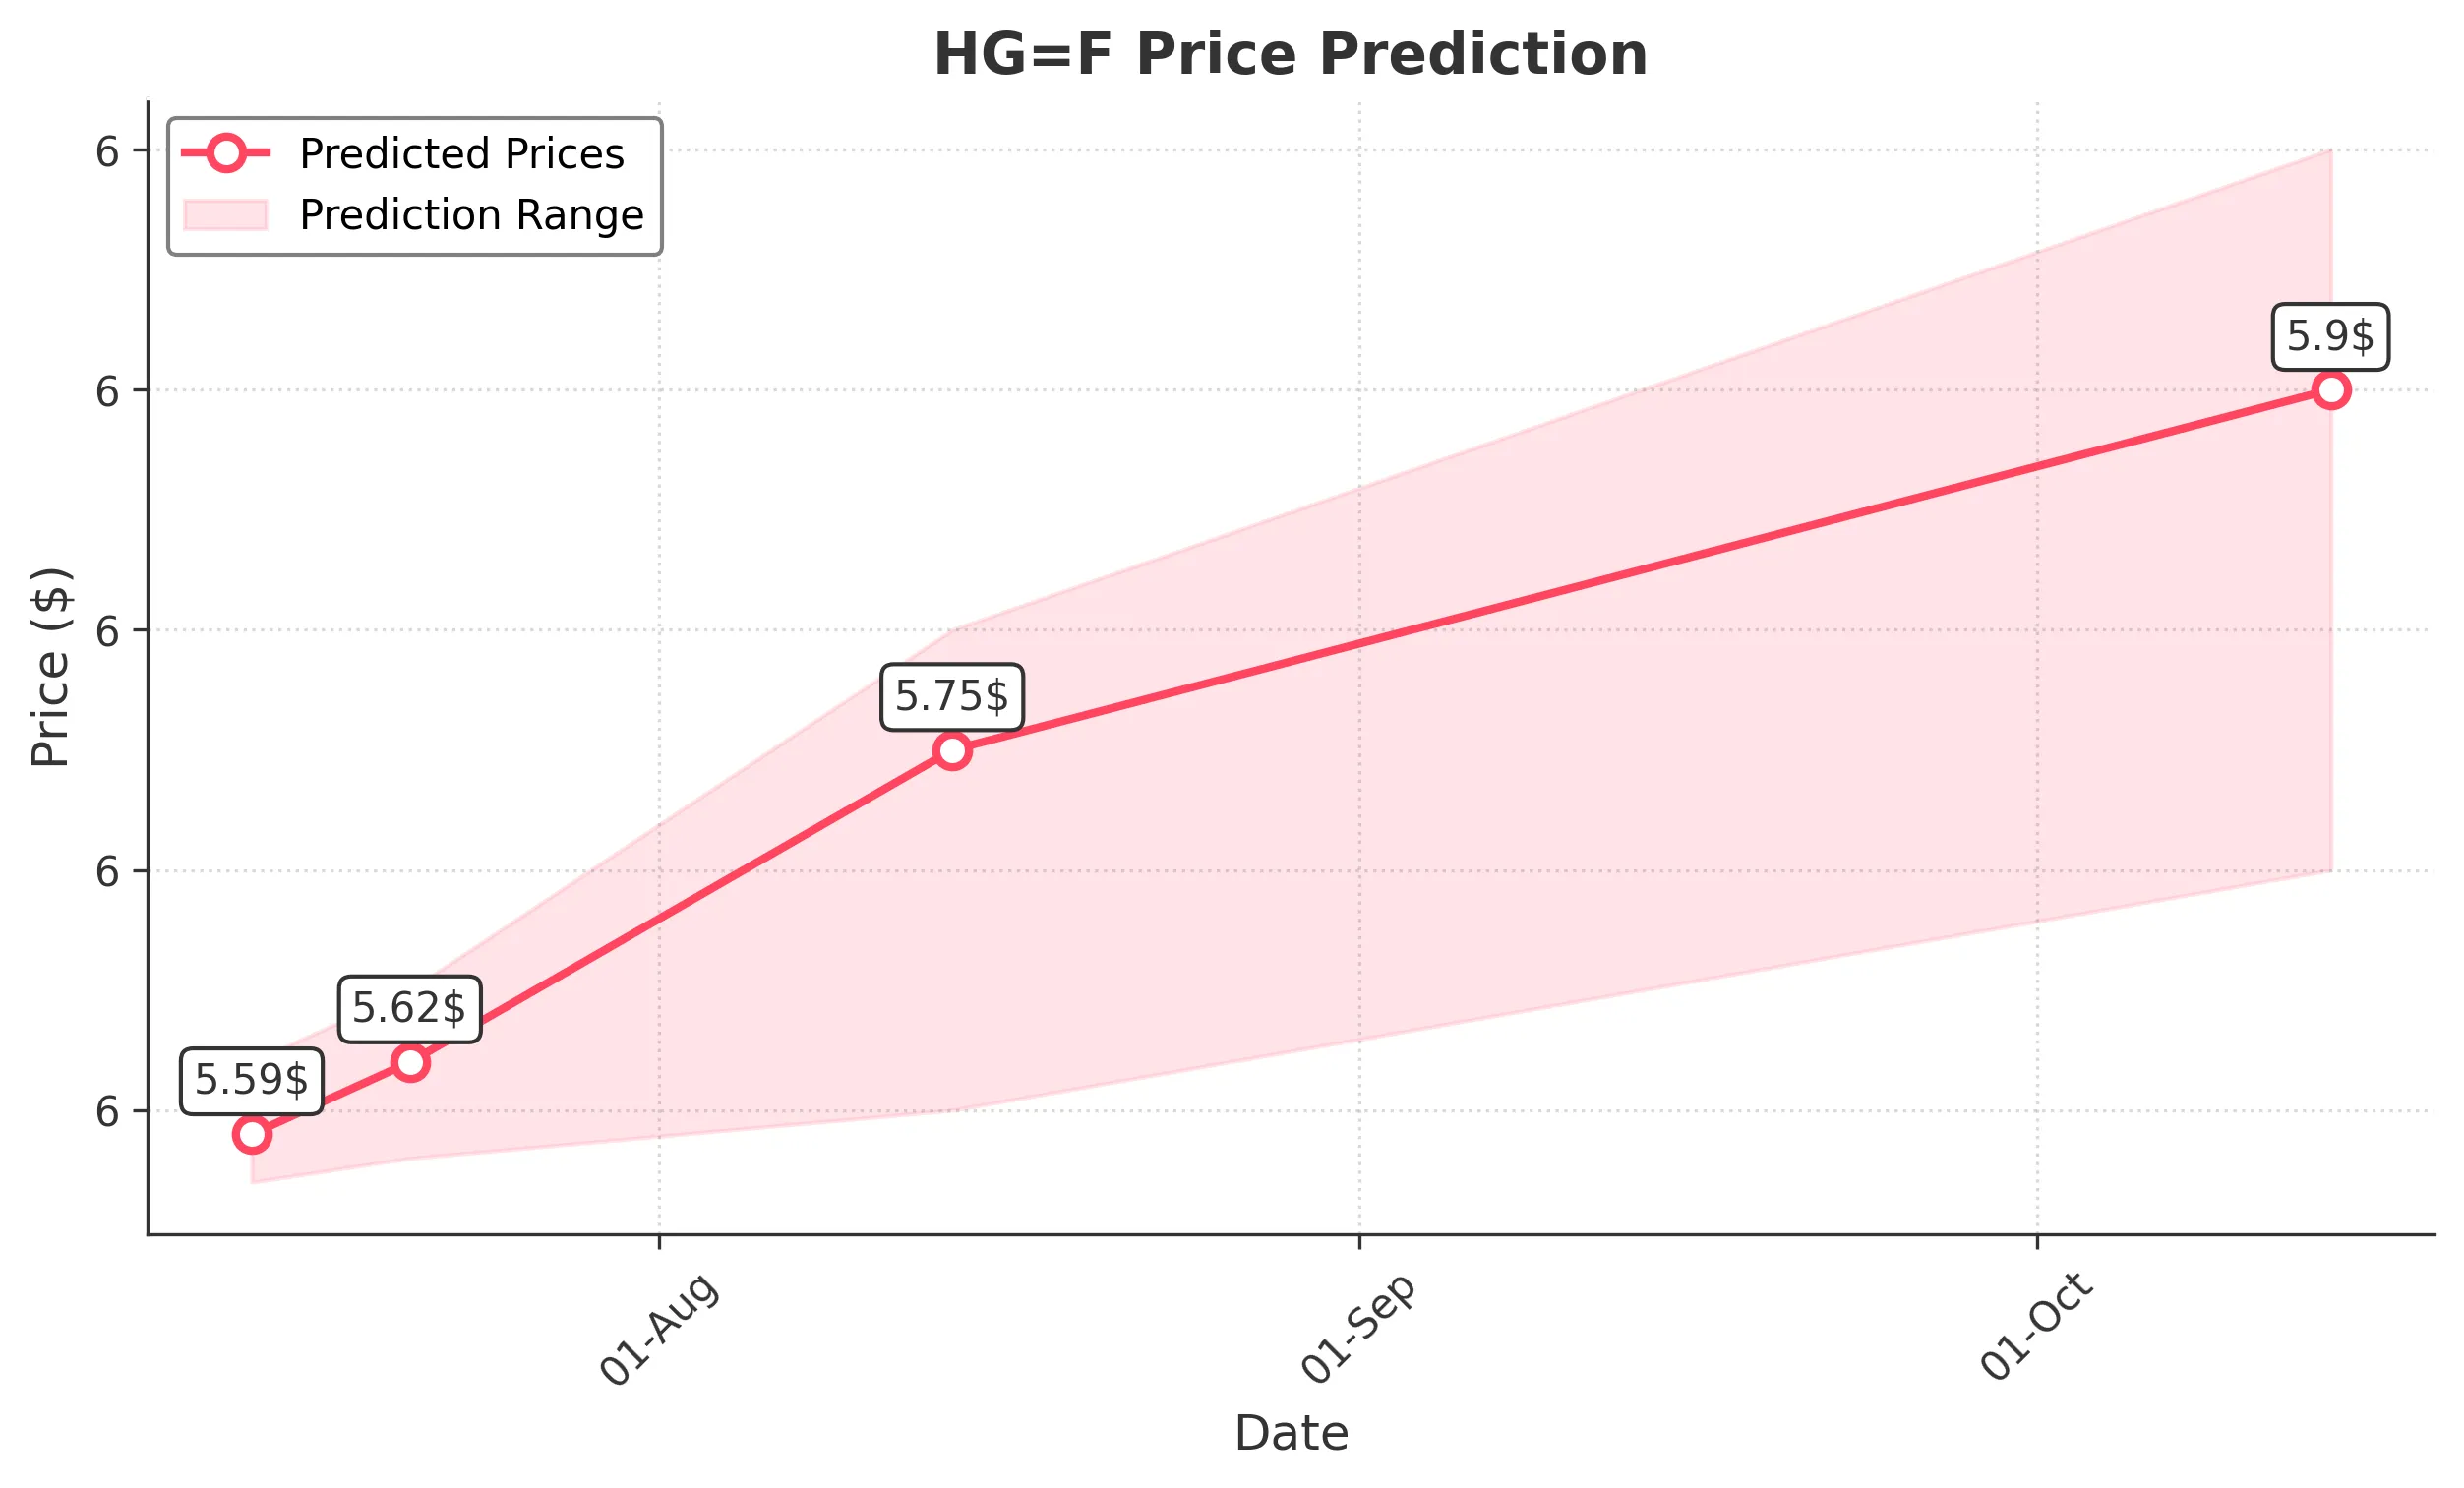
Target: July 14, 2025$5.59
$5.58
$5.62
$5.57
Description
The stock shows a slight bullish trend with recent higher closes. The RSI is approaching overbought levels, indicating potential for a pullback. However, the MACD remains positive, suggesting upward momentum. Volume is expected to be moderate.
Analysis
Over the past 3 months, HG=F has shown a bullish trend with significant upward movement, particularly in late June and early July. Key resistance is around 5.65, while support is at 5.00. Volume spikes indicate strong buying interest, but caution is warranted due to potential overbought conditions.
Confidence Level
Potential Risks
Potential reversal signals from overbought RSI and market volatility could impact the prediction.
1 Week Prediction
Target: July 21, 2025$5.62
$5.59
$5.65
$5.58
Description
The stock is expected to maintain its bullish trend, supported by positive MACD and recent price action. However, the RSI indicates overbought conditions, which may lead to a short-term pullback. Volume is likely to remain steady.
Analysis
The stock has been on an upward trajectory, with significant resistance at 5.65. The recent price action shows strong buying interest, but the overbought RSI suggests caution. Volume patterns indicate healthy trading activity, but external market conditions could introduce risks.
Confidence Level
Potential Risks
Market sentiment and external factors could lead to unexpected volatility, affecting the prediction.
1 Month Prediction
Target: August 14, 2025$5.75
$5.62
$5.8
$5.6
Description
The stock is projected to continue its upward trend, driven by strong demand and positive market sentiment. The MACD remains bullish, and the price is expected to break through resistance levels. Volume may increase as traders react to positive news.
Analysis
In the last three months, HG=F has shown a strong bullish trend, with key support at 5.00 and resistance at 5.65. The MACD and moving averages indicate continued upward momentum. However, external factors such as economic data releases could introduce volatility.
Confidence Level
Potential Risks
Any negative macroeconomic news or earnings reports could impact the stock's performance.
3 Months Prediction
Target: October 14, 2025$5.9
$5.75
$6
$5.7
Description
The stock is expected to reach new highs as bullish sentiment persists. The technical indicators suggest a strong upward trend, but potential resistance at 6.00 may cause fluctuations. Volume is likely to increase as traders react to market conditions.
Analysis
The overall performance of HG=F has been bullish, with significant upward momentum. Key resistance levels are at 6.00, while support remains at 5.00. The MACD and moving averages indicate a strong trend, but external factors could introduce risks to the forecast.
Confidence Level
Potential Risks
Market corrections or negative news could lead to unexpected price movements.