HGF Trading Predictions
1 Day Prediction
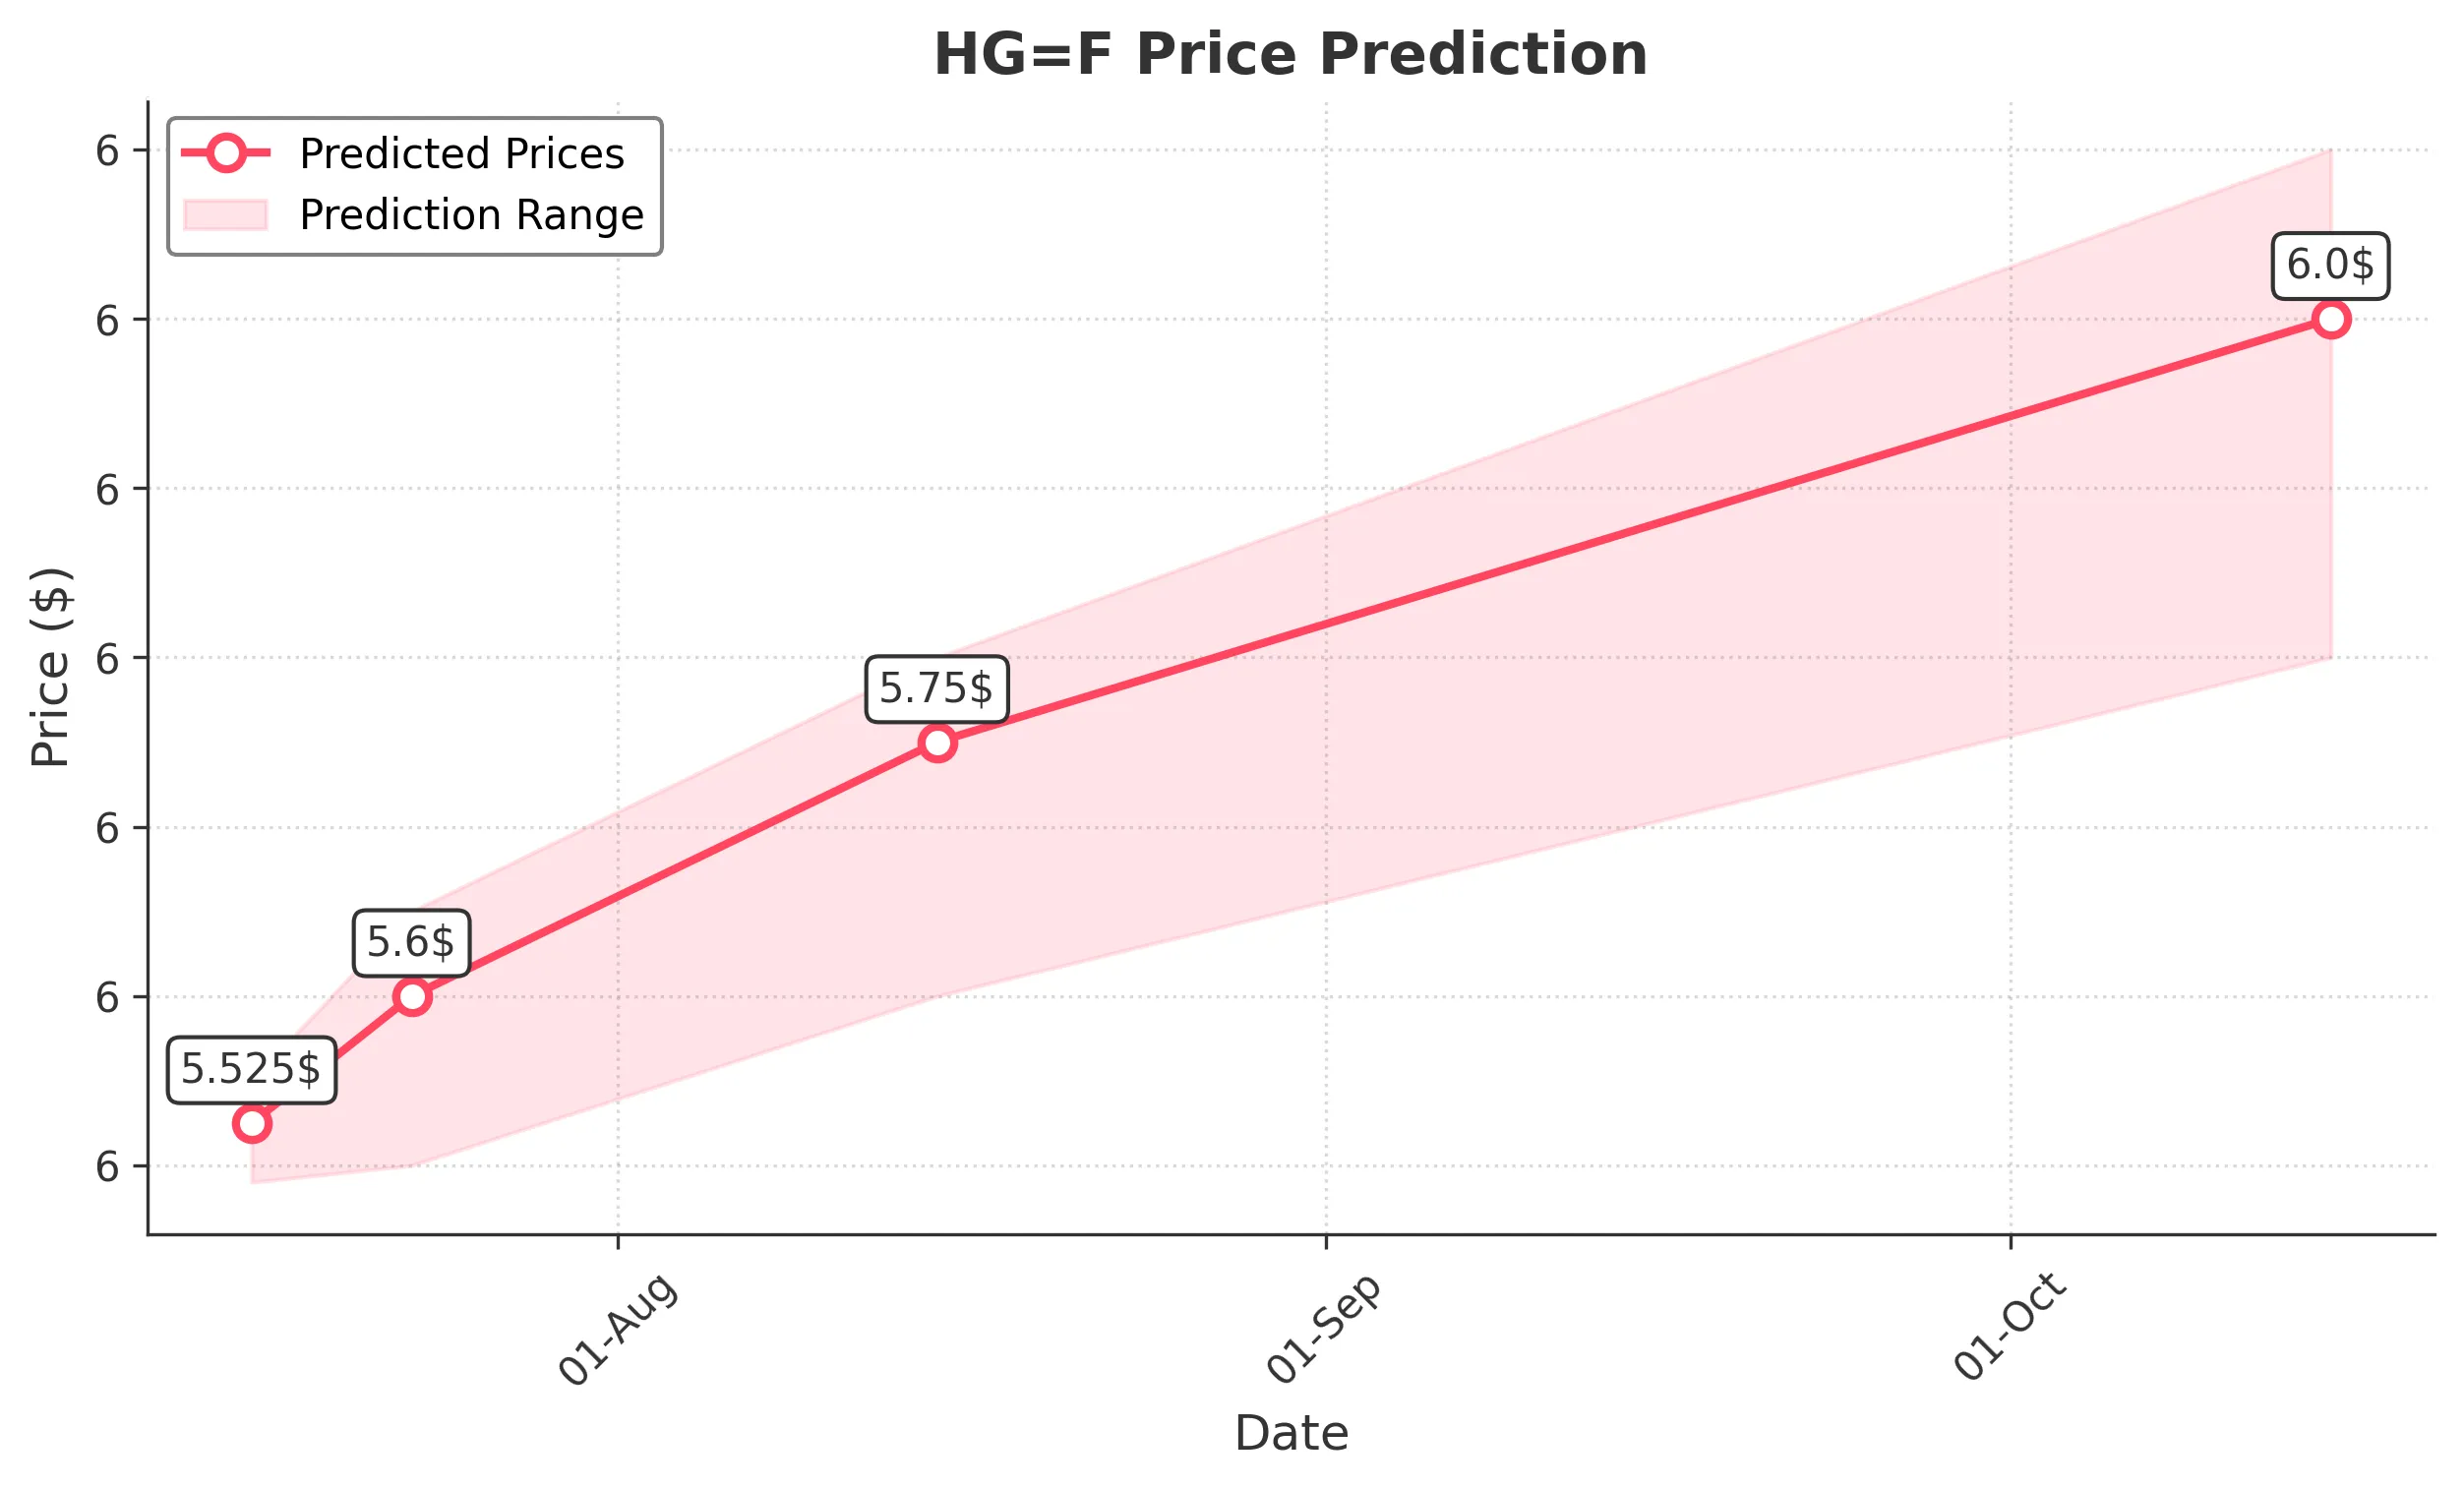
Target: July 16, 2025$5.525
$5.52
$5.55
$5.49
Description
The stock shows a slight bullish trend with a recent close at 5.5195. The RSI is neutral, and MACD indicates potential upward momentum. However, volatility remains a concern with recent price fluctuations.
Analysis
Over the past 3 months, HG=F has shown a bullish trend with significant upward movement, particularly in late June. Key resistance is around 5.65, while support is at 5.00. Volume spikes indicate strong interest, but recent candlestick patterns suggest caution.
Confidence Level
Potential Risks
Market sentiment could shift due to external factors, and a reversal is possible if selling pressure increases.
1 Week Prediction
Target: July 23, 2025$5.6
$5.58
$5.65
$5.5
Description
The stock is expected to continue its upward trajectory, supported by recent bullish candlestick patterns. The MACD is positive, and the RSI is approaching overbought territory, indicating strong buying interest.
Analysis
The stock has been on a bullish run, with significant support at 5.00 and resistance at 5.65. The recent increase in volume suggests strong investor interest. However, the RSI nearing overbought levels indicates a possible pullback.
Confidence Level
Potential Risks
Potential market corrections could impact the price, especially if external economic news is unfavorable.
1 Month Prediction
Target: August 15, 2025$5.75
$5.7
$5.8
$5.6
Description
The stock is likely to maintain its bullish trend, with strong support from technical indicators. The MACD remains positive, and the price is expected to test higher resistance levels.
Analysis
The stock has shown consistent upward movement, with key resistance at 5.80. Volume trends indicate strong buying pressure, but the market remains sensitive to external economic factors that could influence performance.
Confidence Level
Potential Risks
Market volatility and potential economic shifts could lead to unexpected price movements.
3 Months Prediction
Target: October 15, 2025$6
$5.95
$6.1
$5.8
Description
Long-term bullish sentiment is supported by strong technical indicators and market trends. The stock is expected to break through resistance levels, driven by positive market sentiment.
Analysis
The stock has shown a strong bullish trend over the past three months, with significant support at 5.50 and resistance at 6.00. The overall market sentiment is positive, but external economic factors could introduce volatility.
Confidence Level
Potential Risks
Long-term predictions are subject to greater uncertainty due to potential market corrections and economic changes.