HGF Trading Predictions
1 Day Prediction
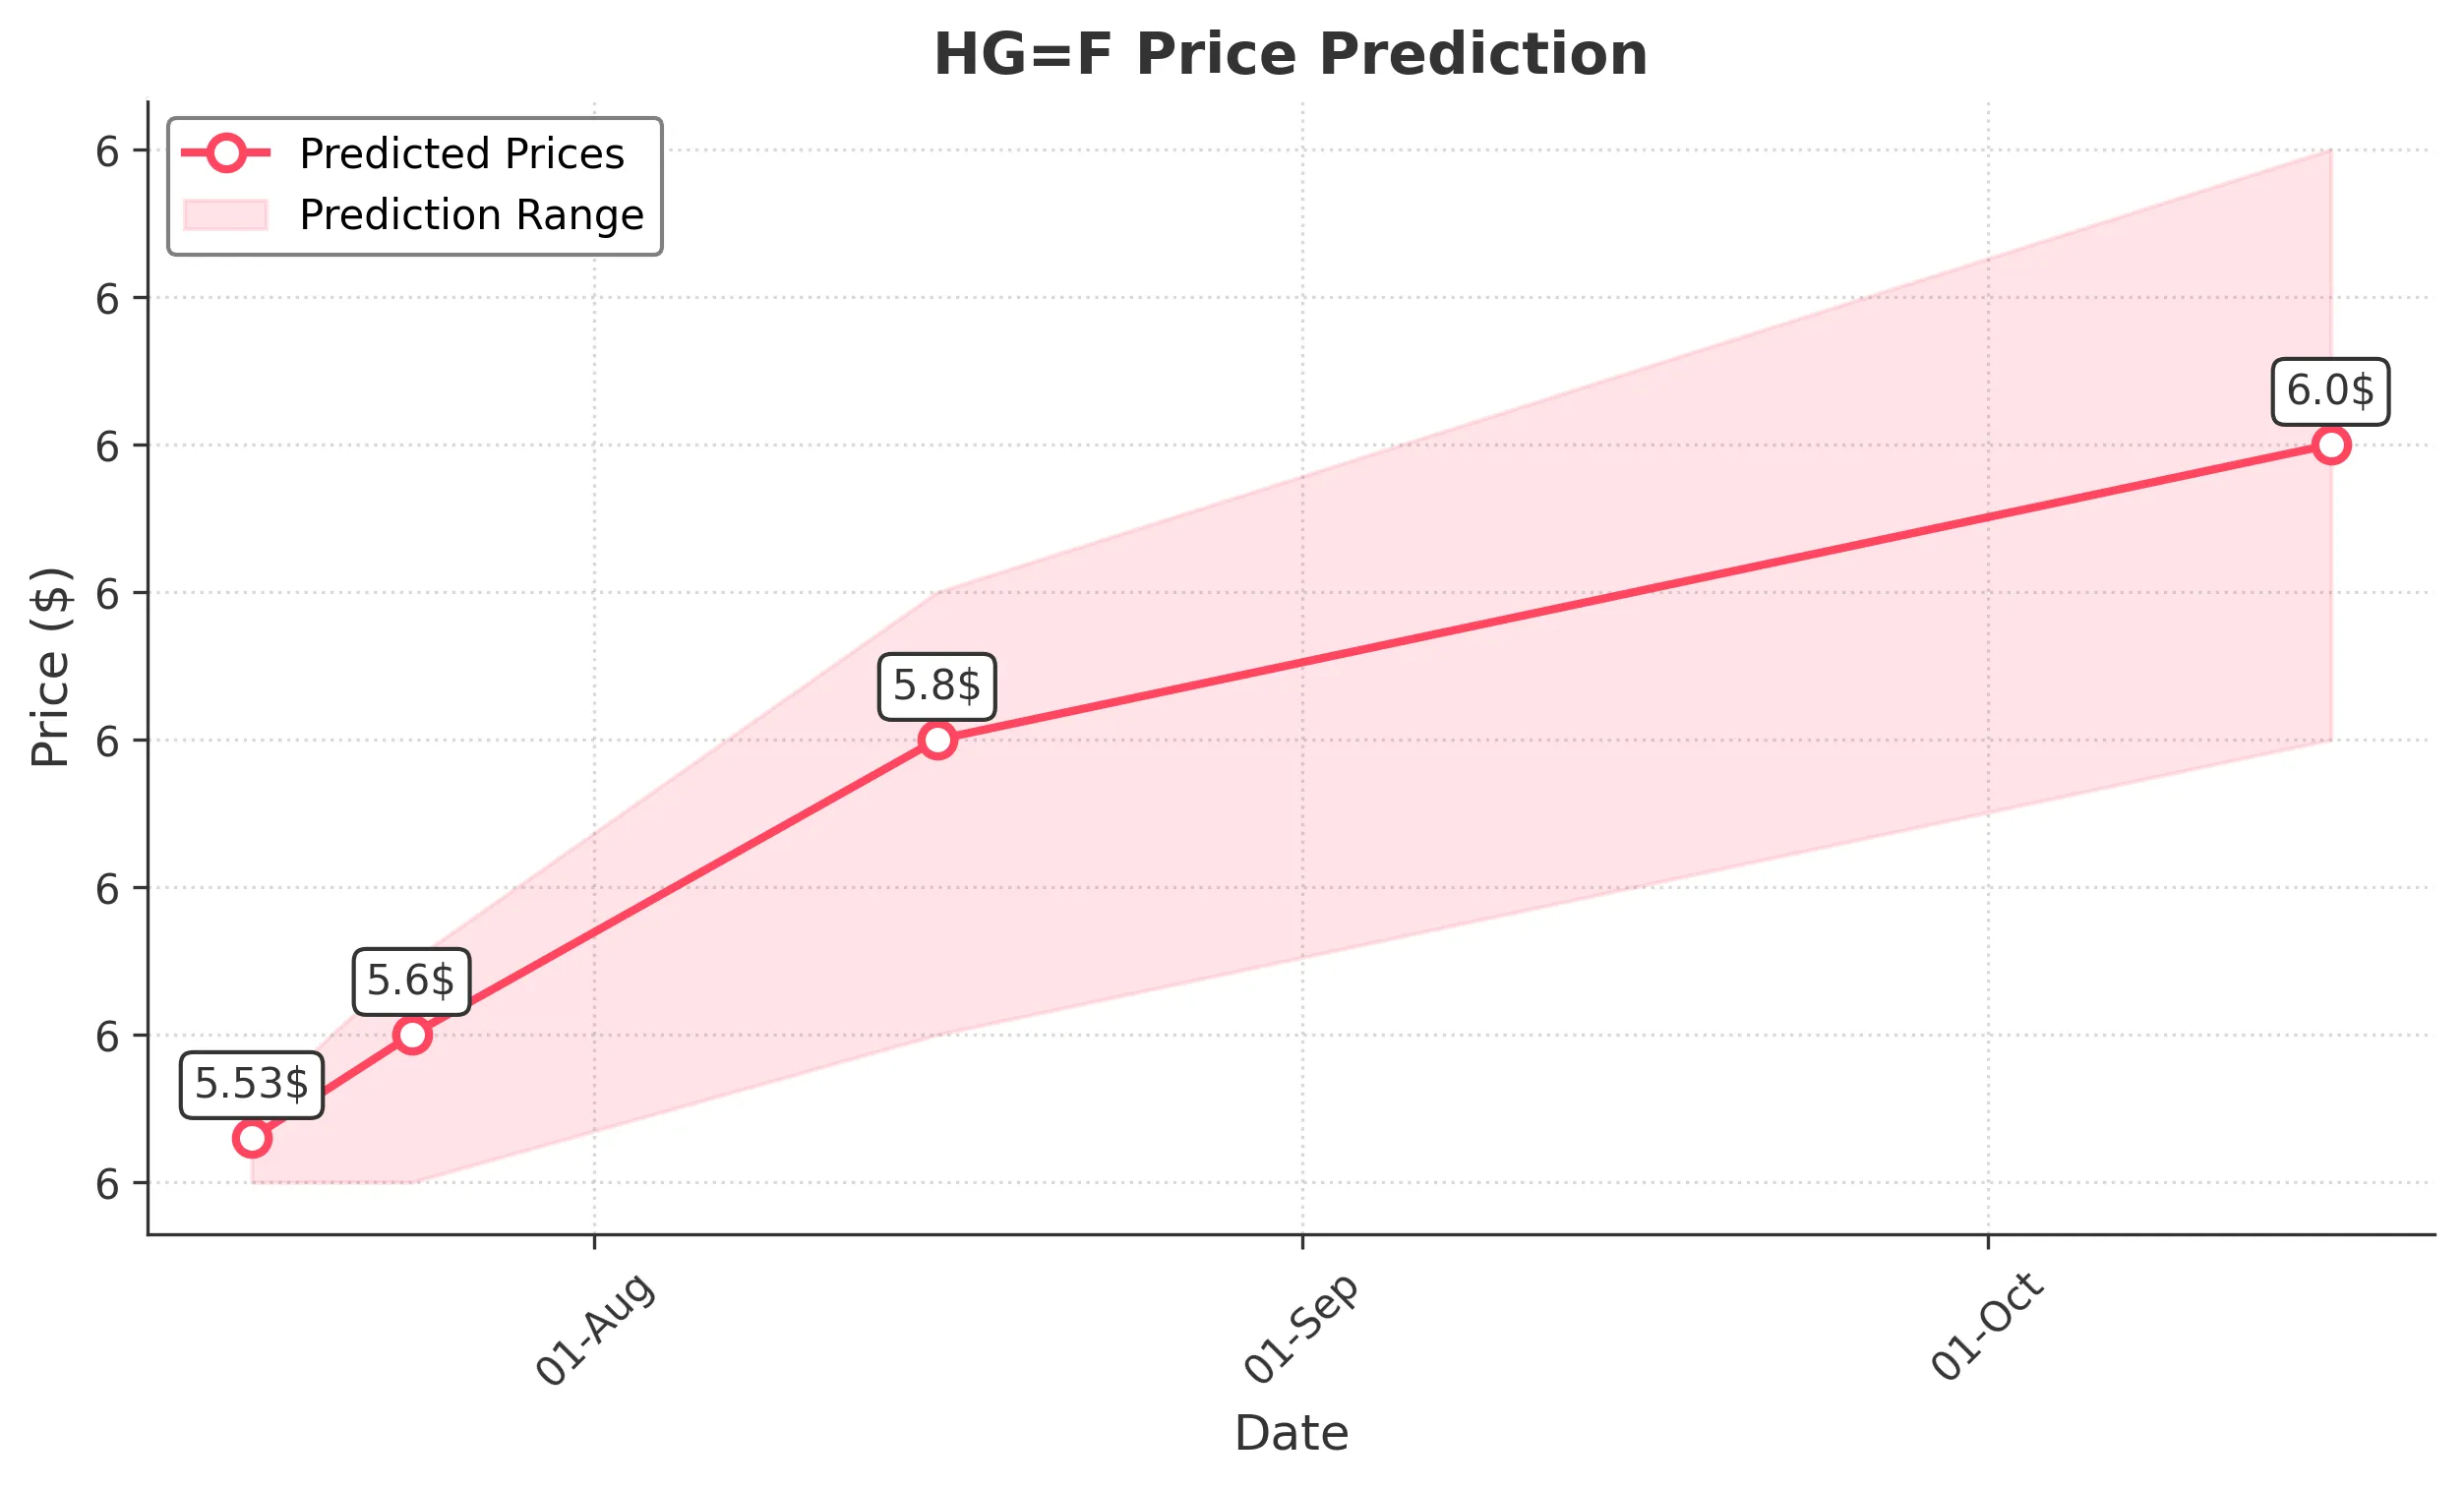
Target: July 17, 2025$5.53
$5.52
$5.55
$5.5
Description
The stock shows a slight bullish trend with a recent Doji candlestick indicating indecision. The RSI is near 60, suggesting room for upward movement. However, MACD is flattening, indicating potential resistance ahead.
Analysis
Over the past 3 months, HG=F has shown a bullish trend with significant support at 5.00 and resistance around 5.60. The recent increase in volume suggests strong buying interest, but the RSI indicates potential overbought conditions.
Confidence Level
Potential Risks
Market volatility and external news could impact the price. A sudden downturn in market sentiment may lead to a price drop.
1 Week Prediction
Target: July 24, 2025$5.6
$5.55
$5.65
$5.5
Description
The stock is expected to continue its upward momentum, supported by a bullish MACD crossover. The Bollinger Bands are widening, indicating increased volatility. However, the RSI nearing 70 suggests caution.
Analysis
The stock has been trending upward with strong support at 5.50. The recent price action shows bullish candlestick patterns, and the volume has been increasing, indicating strong buying pressure.
Confidence Level
Potential Risks
Potential market corrections or negative news could reverse the trend. Watch for any bearish candlestick patterns.
1 Month Prediction
Target: August 16, 2025$5.8
$5.7
$5.9
$5.6
Description
The stock is likely to reach new highs as it breaks through resistance levels. The Fibonacci retracement levels suggest a target around 5.80. However, the RSI indicates potential overbought conditions.
Analysis
The stock has shown a strong bullish trend with key support at 5.50 and resistance at 5.80. The MACD is bullish, and the volume has been increasing, indicating strong buying interest.
Confidence Level
Potential Risks
Market sentiment can shift quickly, and any negative economic news could impact the stock's performance. Watch for signs of reversal.
3 Months Prediction
Target: October 16, 2025$6
$5.9
$6.2
$5.8
Description
The stock is expected to continue its upward trajectory, potentially reaching 6.00. The overall market sentiment is bullish, but the RSI indicates a risk of pullback. Watch for any bearish signals.
Analysis
The stock has been on a bullish trend with significant support at 5.50 and resistance at 6.00. The MACD remains bullish, but the RSI suggests caution as it approaches overbought territory.
Confidence Level
Potential Risks
Long-term predictions are subject to greater uncertainty. Economic changes or market corrections could significantly impact the stock's price.