HGF Trading Predictions
1 Day Prediction
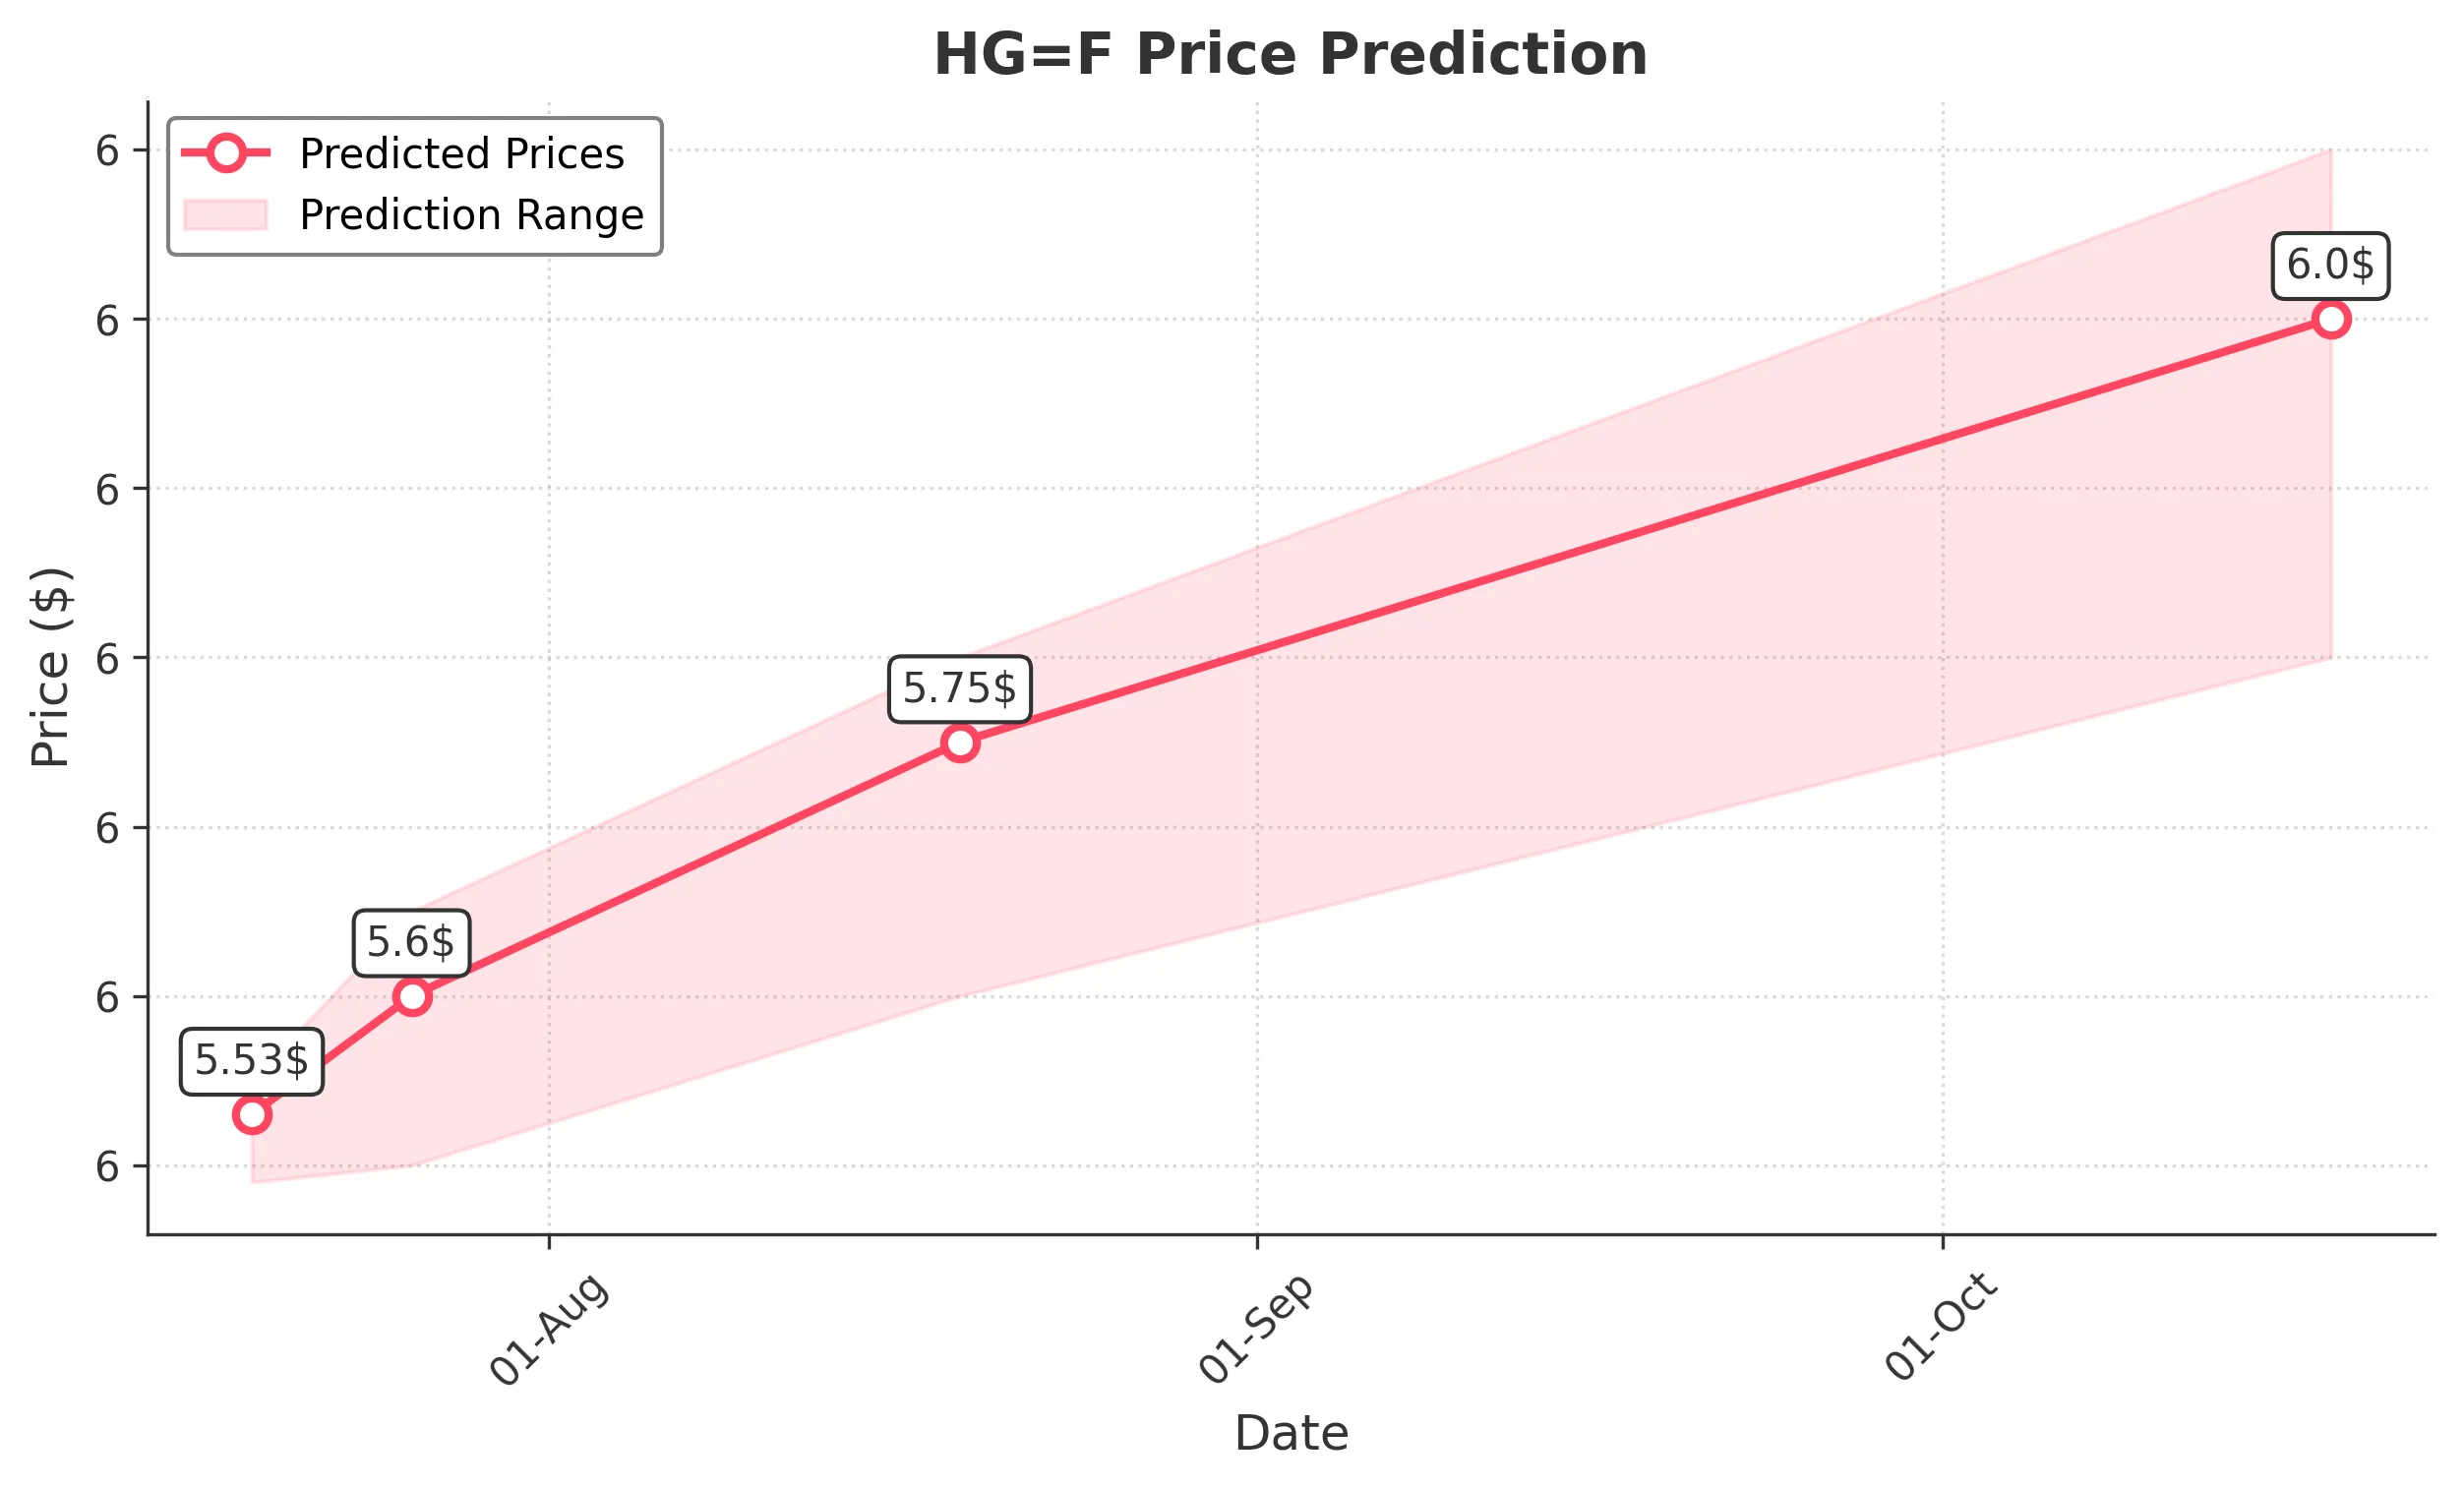
Target: July 19, 2025$5.53
$5.525
$5.55
$5.49
Description
The stock shows a slight bullish trend with a recent Doji pattern indicating indecision. The RSI is near 60, suggesting upward momentum. However, MACD is flattening, indicating potential resistance ahead.
Analysis
Over the past 3 months, HG=F has shown a bullish trend with significant support at 5.45 and resistance around 5.65. The recent volume spikes indicate strong interest, but the RSI nearing overbought levels suggests caution.
Confidence Level
Potential Risks
Market volatility and external news could impact the price. A reversal is possible if bearish sentiment increases.
1 Week Prediction
Target: July 26, 2025$5.6
$5.55
$5.65
$5.5
Description
The stock is expected to continue its upward trajectory, supported by a bullish MACD crossover. The Bollinger Bands are widening, indicating increased volatility, which may favor upward movement.
Analysis
The stock has been in a bullish phase, with key support at 5.45 and resistance at 5.65. The recent candlestick patterns suggest bullish sentiment, but the RSI indicates caution as it approaches overbought territory.
Confidence Level
Potential Risks
Potential market corrections or negative news could lead to a pullback. Watch for volume trends as a signal of strength.
1 Month Prediction
Target: August 19, 2025$5.75
$5.7
$5.8
$5.6
Description
The stock is likely to reach new highs as bullish momentum continues. Fibonacci retracement levels suggest a target around 5.75, with strong support at 5.60.
Analysis
The stock has shown consistent upward movement, with significant volume increases. The RSI is approaching overbought levels, and the MACD remains bullish, indicating potential for further gains.
Confidence Level
Potential Risks
Economic indicators and market sentiment could shift, impacting the bullish trend. Watch for any signs of reversal.
3 Months Prediction
Target: October 18, 2025$6
$5.95
$6.1
$5.8
Description
Long-term bullish sentiment is supported by strong fundamentals and technical indicators. The stock is expected to break through resistance levels, with potential for further gains.
Analysis
The stock has been on a bullish trend, with key support at 5.60 and resistance at 6.00. The overall market sentiment is positive, but external factors could introduce volatility.
Confidence Level
Potential Risks
Macroeconomic factors and potential market corrections could impact the forecast. A bearish reversal is possible if sentiment shifts.