HGF Trading Predictions
1 Day Prediction
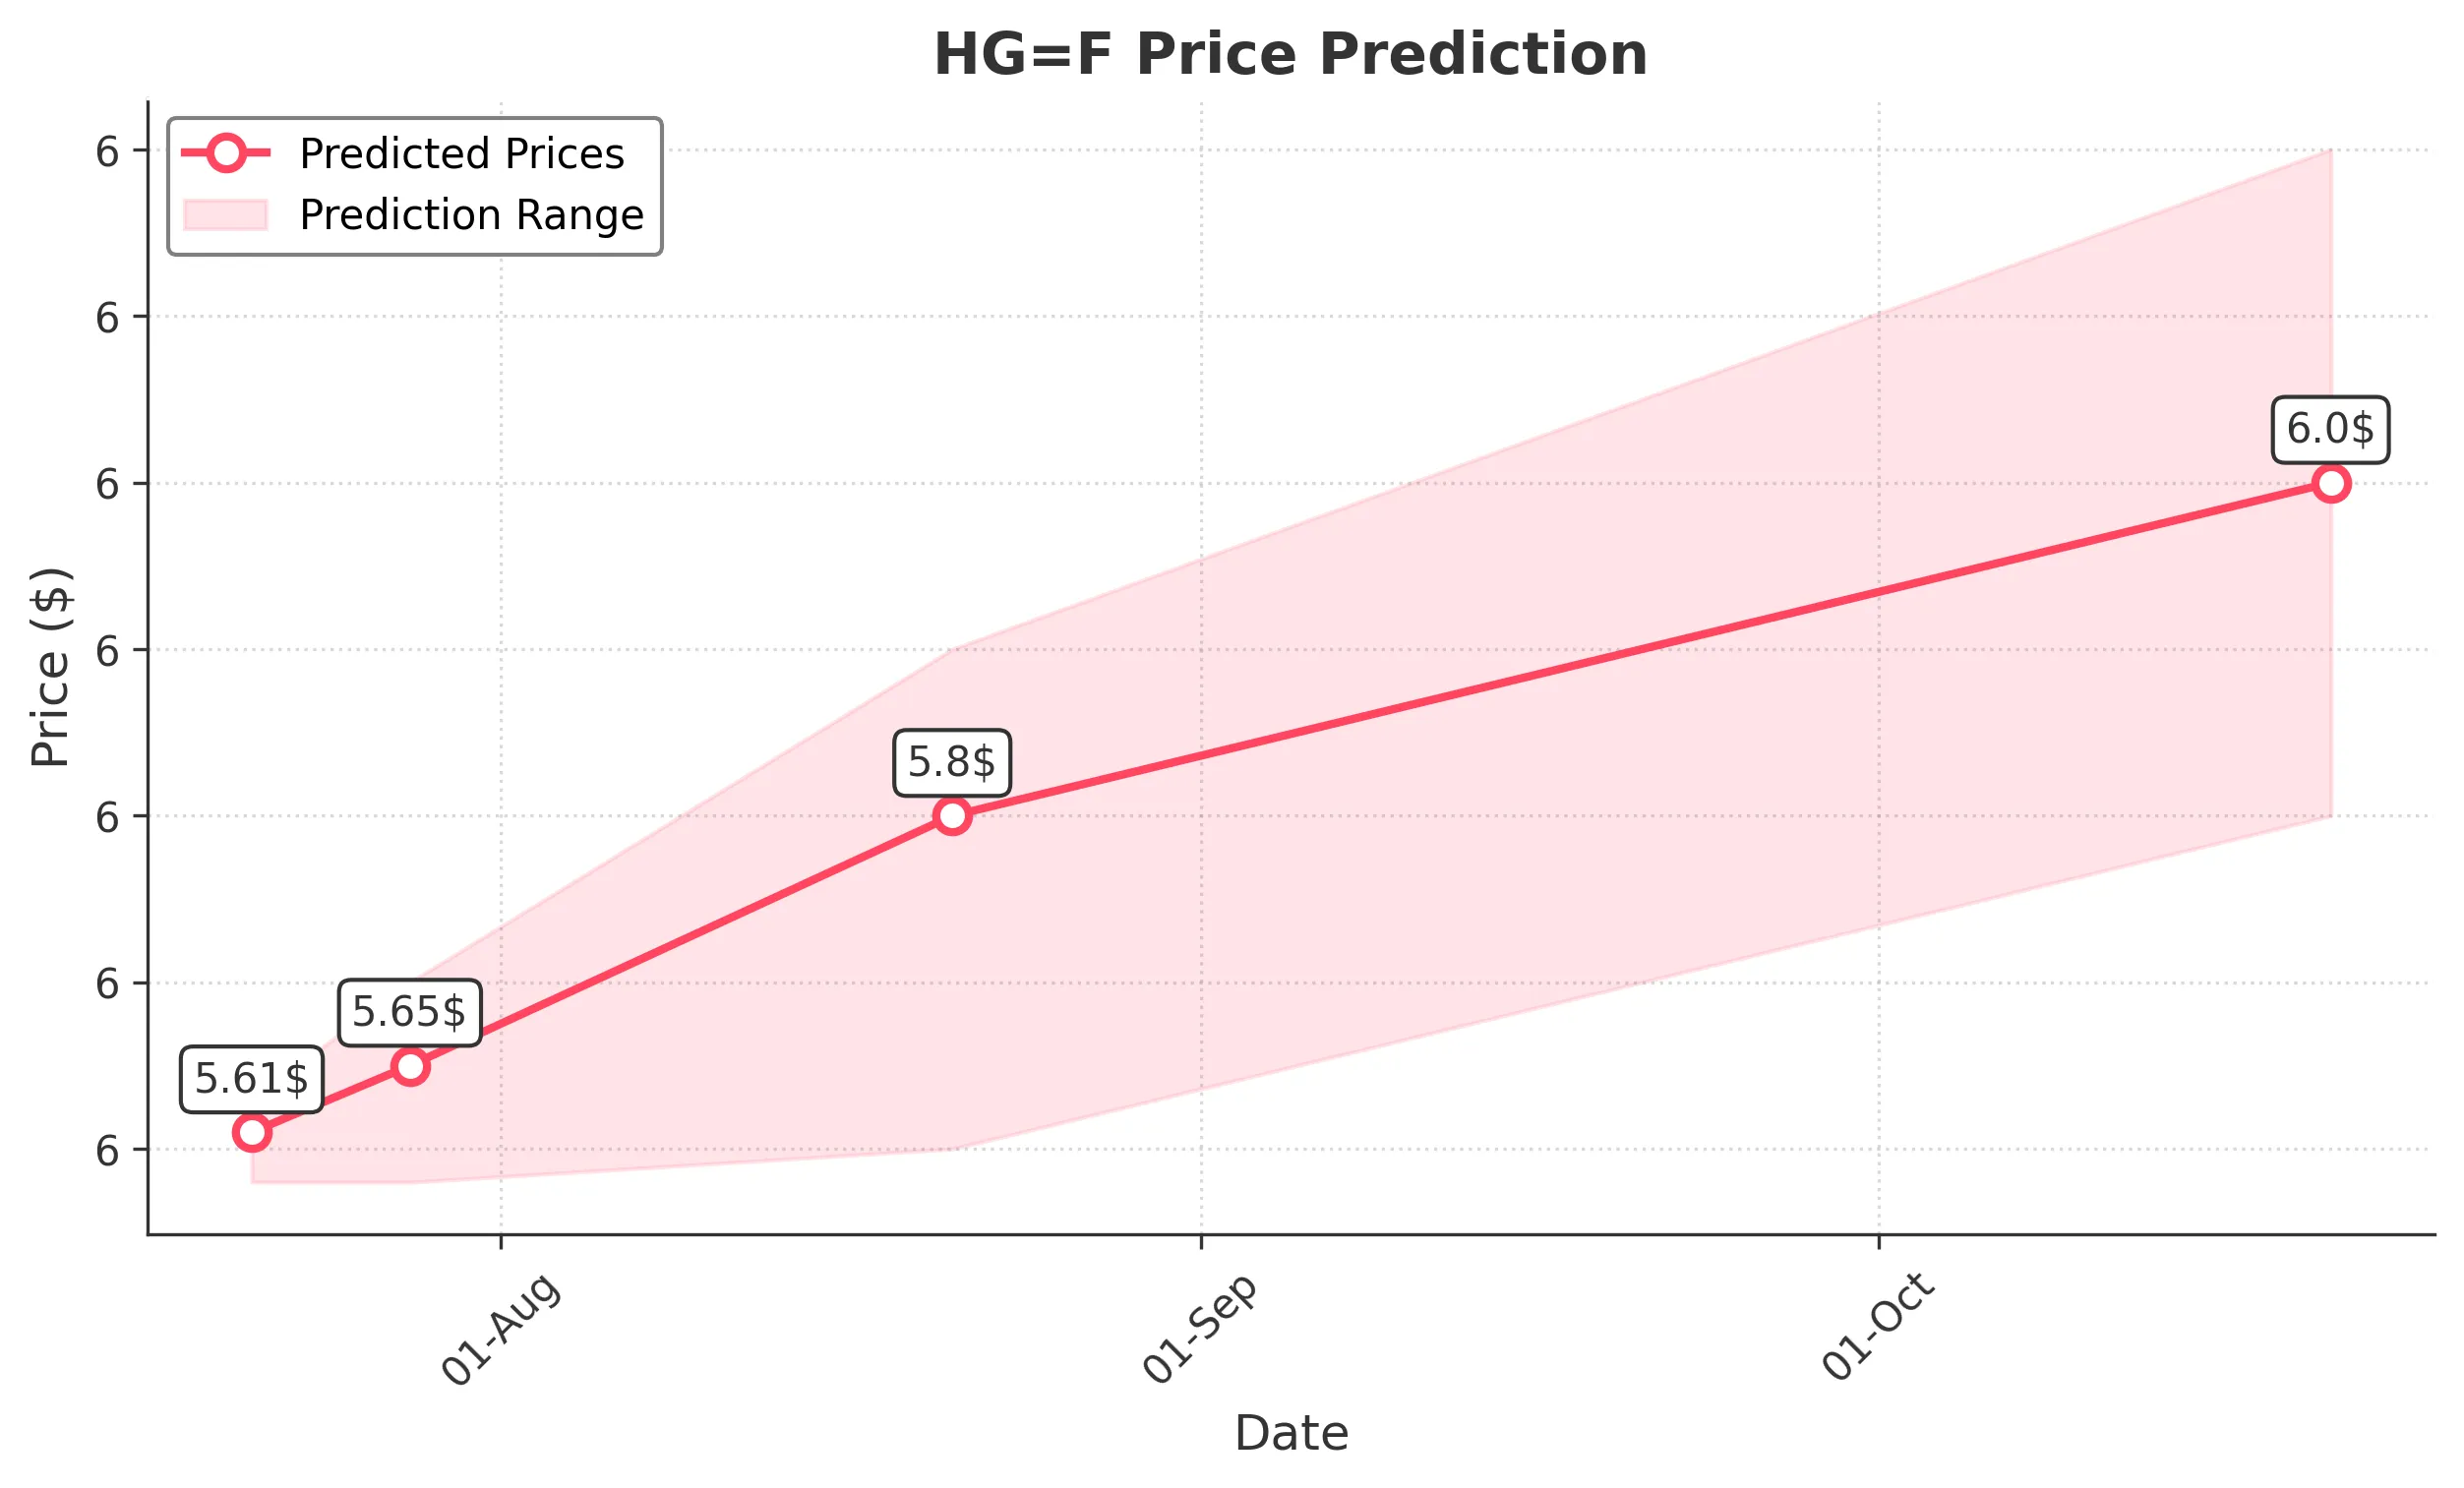
Target: July 21, 2025$5.61
$5.605
$5.63
$5.58
Description
The stock shows a bullish trend with a recent upward movement. The RSI is approaching overbought levels, indicating potential for a pullback. However, the MACD remains positive, suggesting continued momentum. Volume is expected to be moderate.
Analysis
Over the past 3 months, HG=F has shown a bullish trend, with significant support at 5.4500 and resistance around 5.6500. The MACD indicates upward momentum, while the RSI is nearing overbought territory. Recent volume spikes suggest strong interest.
Confidence Level
Potential Risks
Potential for a short-term pullback due to overbought RSI conditions.
1 Week Prediction
Target: July 28, 2025$5.65
$5.62
$5.7
$5.58
Description
The stock is expected to continue its upward trajectory, supported by bullish sentiment and positive technical indicators. However, the RSI indicates potential overbought conditions, which could lead to volatility.
Analysis
The stock has maintained a bullish trend with key support at 5.5000. The MACD remains positive, and recent volume trends indicate strong buying interest. However, the RSI suggests caution as it approaches overbought levels.
Confidence Level
Potential Risks
Market volatility and potential profit-taking could impact price stability.
1 Month Prediction
Target: August 21, 2025$5.8
$5.65
$5.9
$5.6
Description
The stock is projected to rise further as bullish momentum persists. The MACD indicates a strong upward trend, while the RSI may stabilize as the price increases. Watch for potential resistance at 5.9000.
Analysis
The stock has shown consistent upward movement, with significant resistance at 5.9000. The MACD supports continued bullish momentum, but the RSI indicates potential for a correction. Volume patterns suggest sustained interest.
Confidence Level
Potential Risks
External market factors and economic data releases could influence price direction.
3 Months Prediction
Target: October 21, 2025$6
$5.85
$6.2
$5.8
Description
Long-term bullish sentiment is expected to drive prices higher, supported by strong fundamentals and technical indicators. However, market corrections may occur, and external economic factors could introduce volatility.
Analysis
The stock has shown a strong bullish trend over the past three months, with key support at 5.5000 and resistance at 6.2000. The MACD indicates a strong upward trend, but the RSI suggests caution. Volume trends indicate sustained interest, but external factors could introduce volatility.
Confidence Level
Potential Risks
Unforeseen macroeconomic events and market sentiment shifts could impact the forecast.