HGF Trading Predictions
1 Day Prediction
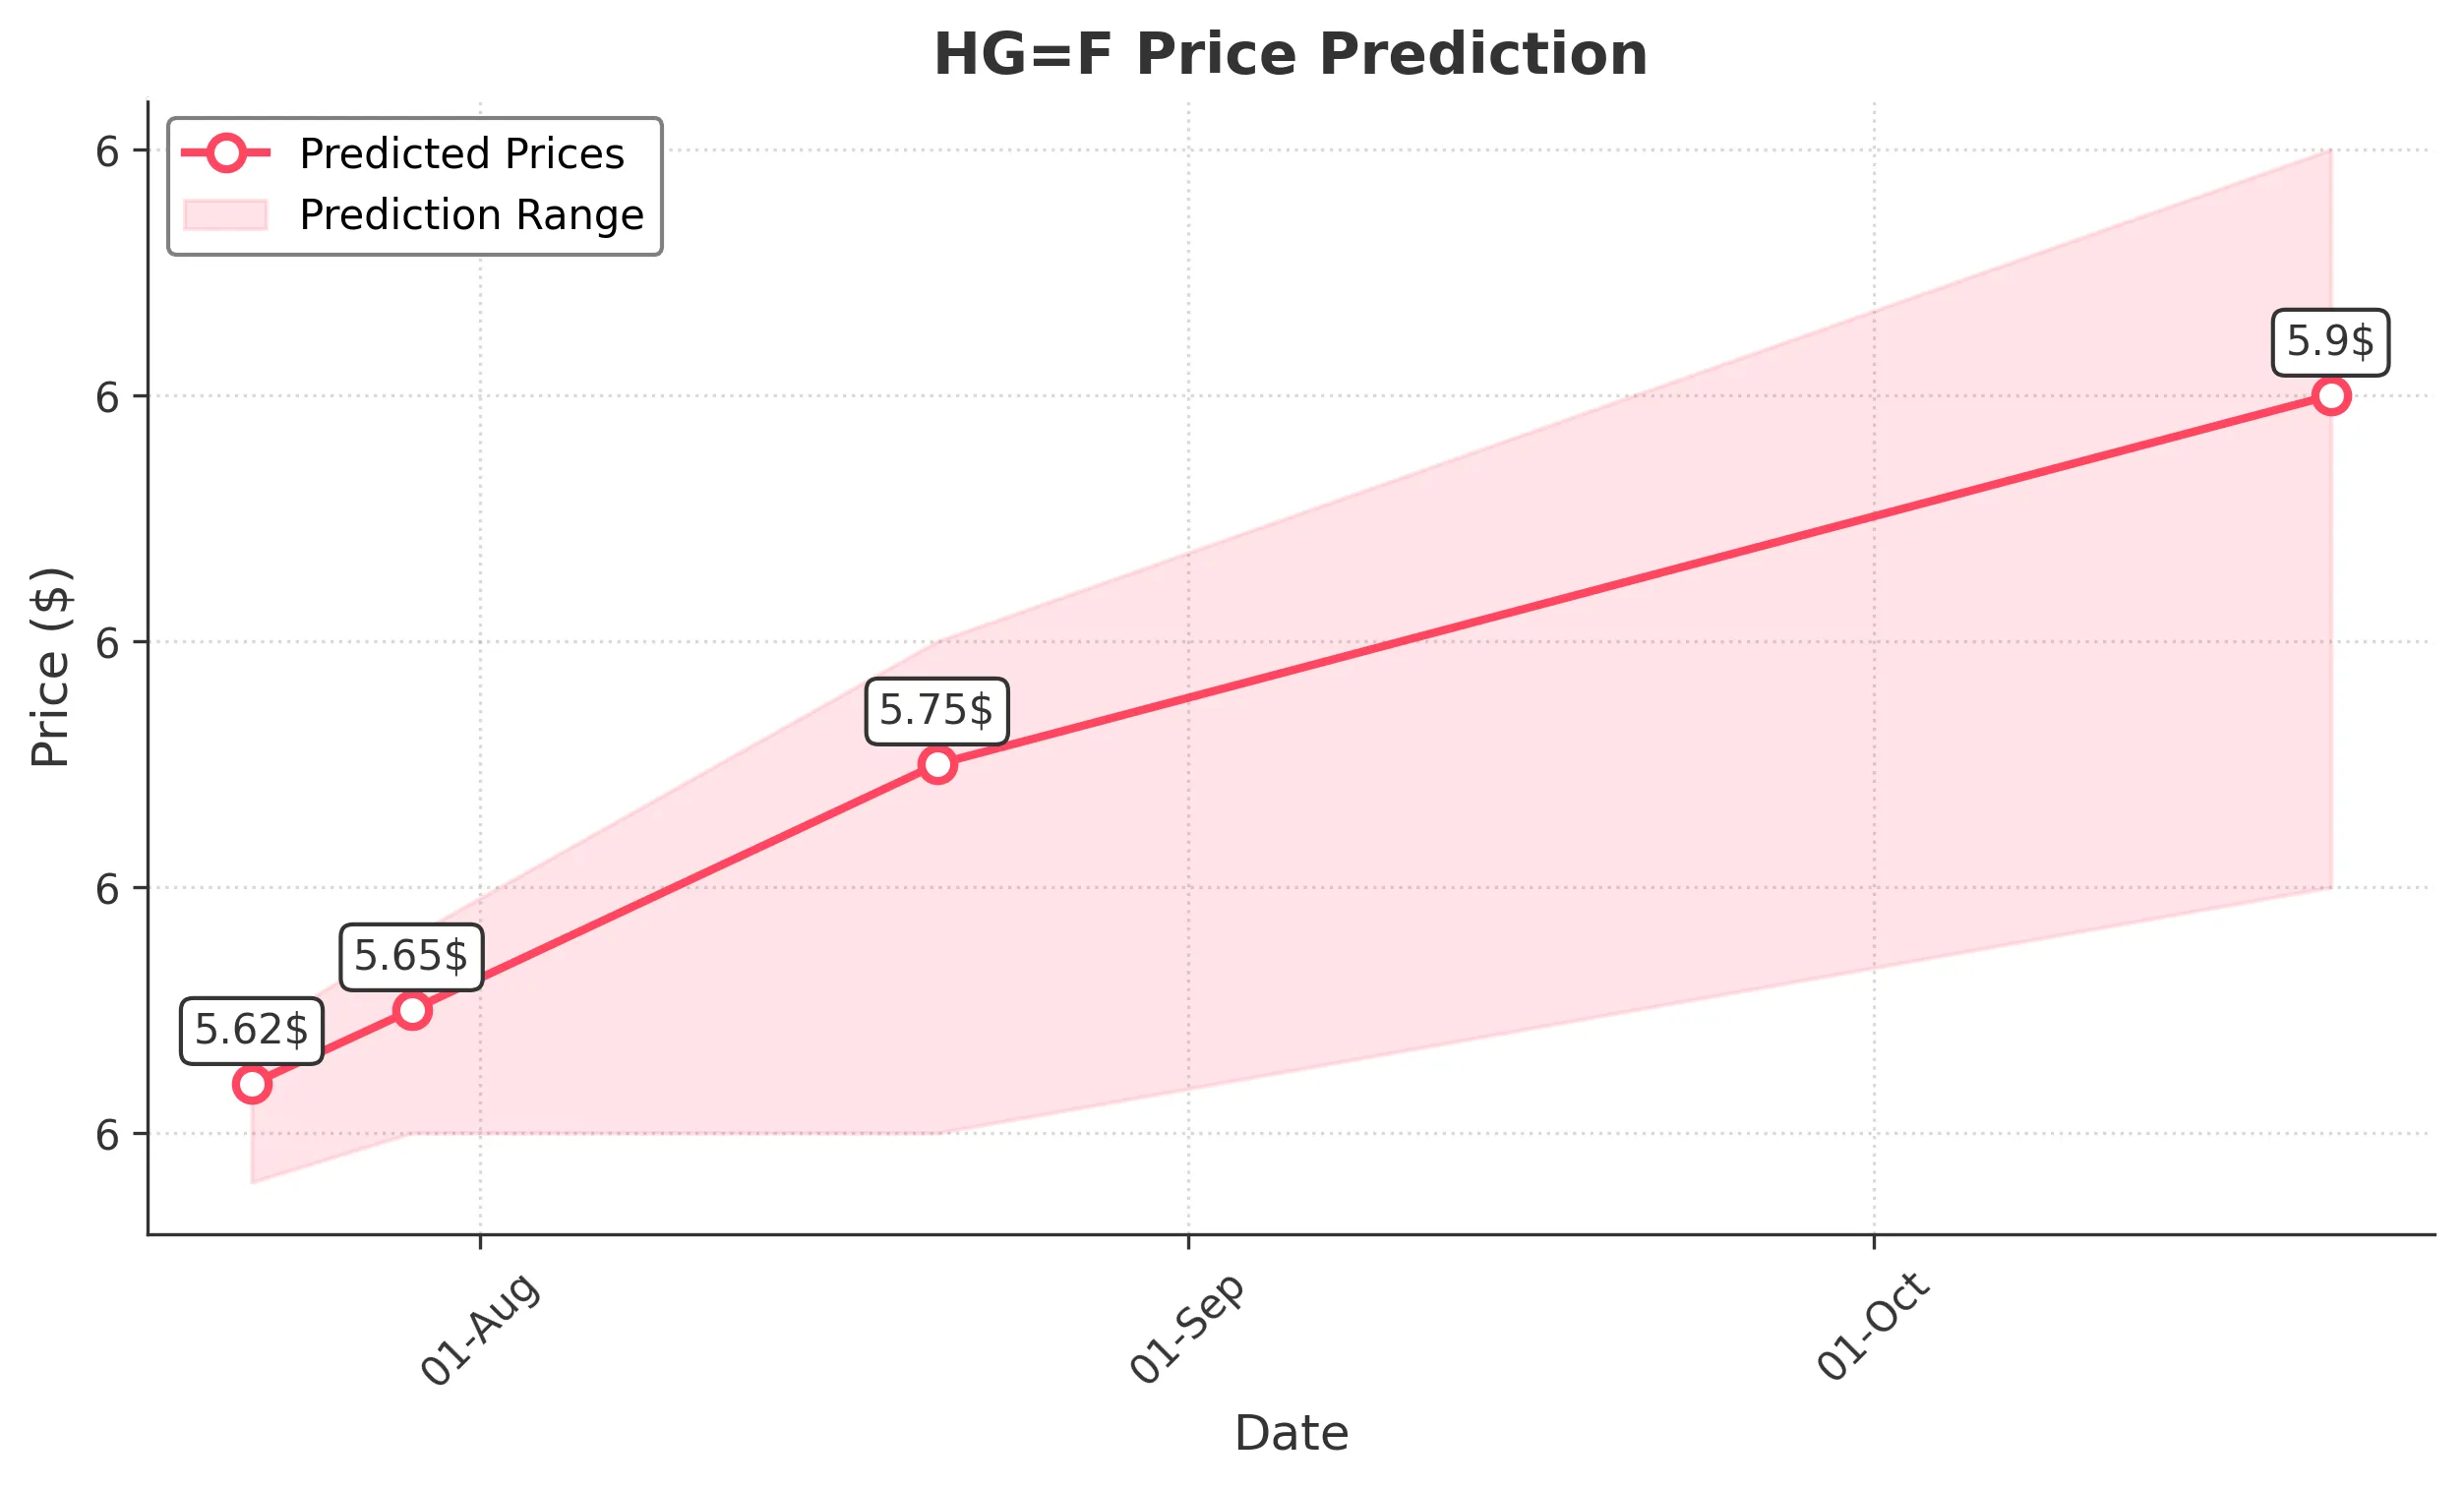
Target: July 22, 2025$5.62
$5.61
$5.64
$5.58
Description
The stock shows a bullish trend with a recent close above the 20-day moving average. RSI is at 65, indicating strength, while MACD is positive. A Doji pattern suggests indecision, but overall sentiment remains bullish.
Analysis
Over the past 3 months, HG=F has shown a bullish trend, with significant support at 5.4500 and resistance at 5.6800. The recent price action indicates a strong upward momentum, supported by increasing volume and positive technical indicators.
Confidence Level
Potential Risks
Potential market volatility could impact the prediction, especially if external news arises.
1 Week Prediction
Target: July 29, 2025$5.65
$5.62
$5.68
$5.6
Description
The stock is expected to continue its upward trajectory, supported by bullish momentum indicators. The MACD remains positive, and the RSI is approaching overbought territory, suggesting a potential pullback.
Analysis
The stock has maintained a bullish trend with key support at 5.5000. The recent price action shows strong buying interest, but the RSI nearing overbought levels indicates caution. Volume patterns suggest sustained interest, but external factors could introduce volatility.
Confidence Level
Potential Risks
Market corrections or negative news could lead to a reversal, impacting the forecast.
1 Month Prediction
Target: August 21, 2025$5.75
$5.65
$5.8
$5.6
Description
The stock is projected to rise as bullish sentiment persists. The 50-day moving average is trending upwards, and Fibonacci retracement levels indicate potential resistance at 5.8000. Watch for volume spikes.
Analysis
The stock has shown a strong bullish trend, with significant support at 5.5000 and resistance at 5.8000. Technical indicators suggest continued upward momentum, but the market's overall sentiment and external factors could introduce risks.
Confidence Level
Potential Risks
A market correction or negative macroeconomic news could hinder growth, leading to unexpected price movements.
3 Months Prediction
Target: October 21, 2025$5.9
$5.8
$6
$5.7
Description
Long-term bullish outlook as the stock approaches key resistance levels. The MACD remains positive, and the overall trend is supported by strong volume. However, watch for potential market corrections.
Analysis
The stock has shown a consistent upward trend, with key support at 5.5000 and resistance at 6.0000. While technical indicators are bullish, the potential for market corrections and external influences must be considered for a balanced outlook.
Confidence Level
Potential Risks
Unforeseen macroeconomic events or shifts in market sentiment could lead to volatility and impact the forecast.