HGF Trading Predictions
1 Day Prediction
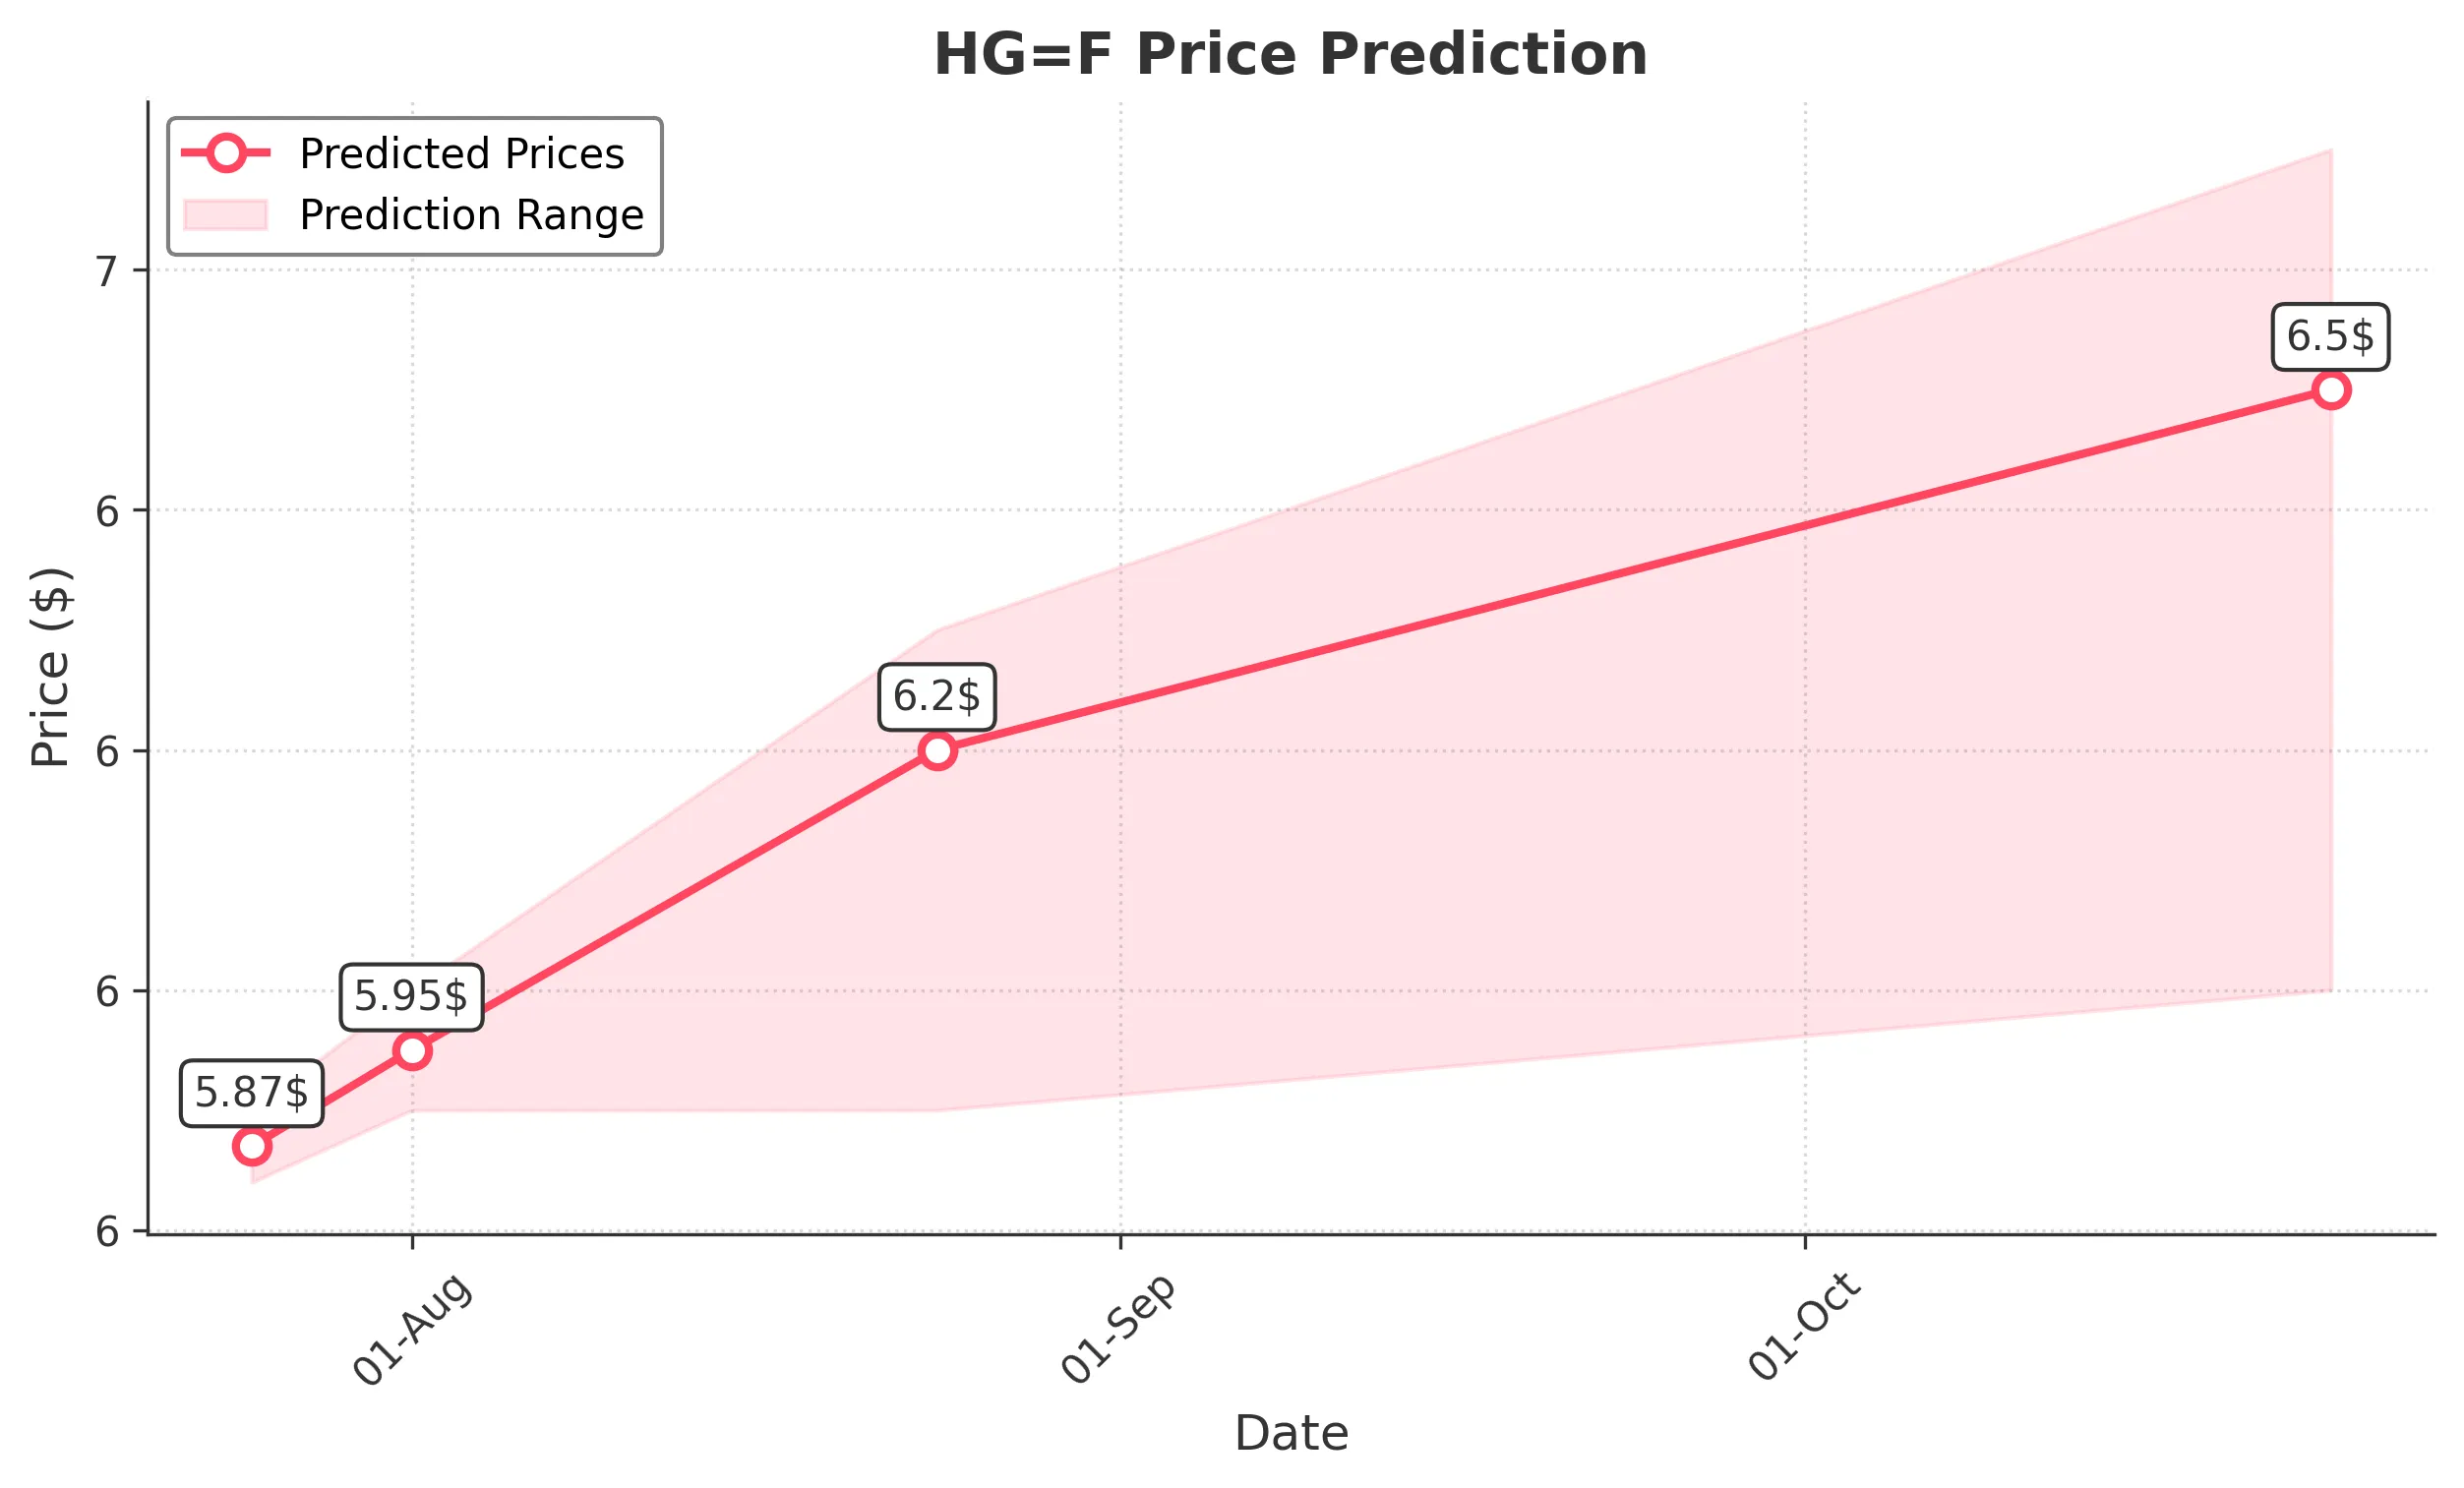
Target: July 25, 2025$5.87
$5.86
$5.9
$5.84
Description
The stock shows a bullish trend with a recent upward movement. The MACD is positive, and RSI is approaching overbought territory, indicating potential for a slight pullback. However, the overall sentiment remains strong.
Analysis
Over the past 3 months, HG=F has shown a bullish trend, with significant support at 5.5000 and resistance around 5.9000. The recent price action indicates strong buying interest, but RSI nearing overbought levels suggests caution.
Confidence Level
Potential Risks
Potential for a reversal if market sentiment shifts or if external news impacts trading.
1 Week Prediction
Target: August 1, 2025$5.95
$5.87
$6
$5.9
Description
The bullish momentum is expected to continue, supported by strong volume and positive market sentiment. However, the RSI indicates potential overbought conditions, which could lead to volatility.
Analysis
The stock has been trending upward, with key resistance at 6.0000. Volume spikes indicate strong interest, but the RSI suggests caution as it approaches overbought levels. A pullback could occur if sentiment shifts.
Confidence Level
Potential Risks
Market volatility and external economic factors could impact the price direction.
1 Month Prediction
Target: August 24, 2025$6.2
$5.95
$6.3
$5.9
Description
Continued bullish sentiment is expected, with potential for new highs. The MACD remains positive, and the stock is likely to test resistance levels. However, overbought conditions may lead to corrections.
Analysis
The stock has shown a strong upward trend, with significant support at 5.8000. The MACD and moving averages indicate bullish momentum, but the RSI suggests caution as it approaches overbought territory.
Confidence Level
Potential Risks
External economic events or shifts in market sentiment could lead to unexpected volatility.
3 Months Prediction
Target: October 24, 2025$6.5
$6.2
$6.7
$6
Description
The stock is expected to maintain an upward trajectory, driven by strong fundamentals and market sentiment. However, potential corrections may occur due to overbought conditions.
Analysis
Over the past three months, HG=F has shown a strong bullish trend, with key resistance at 6.7000. The stock's performance is supported by positive technical indicators, but caution is warranted due to potential market corrections.
Confidence Level
Potential Risks
Market volatility and economic changes could significantly impact the stock's performance.