HGF Trading Predictions
1 Day Prediction
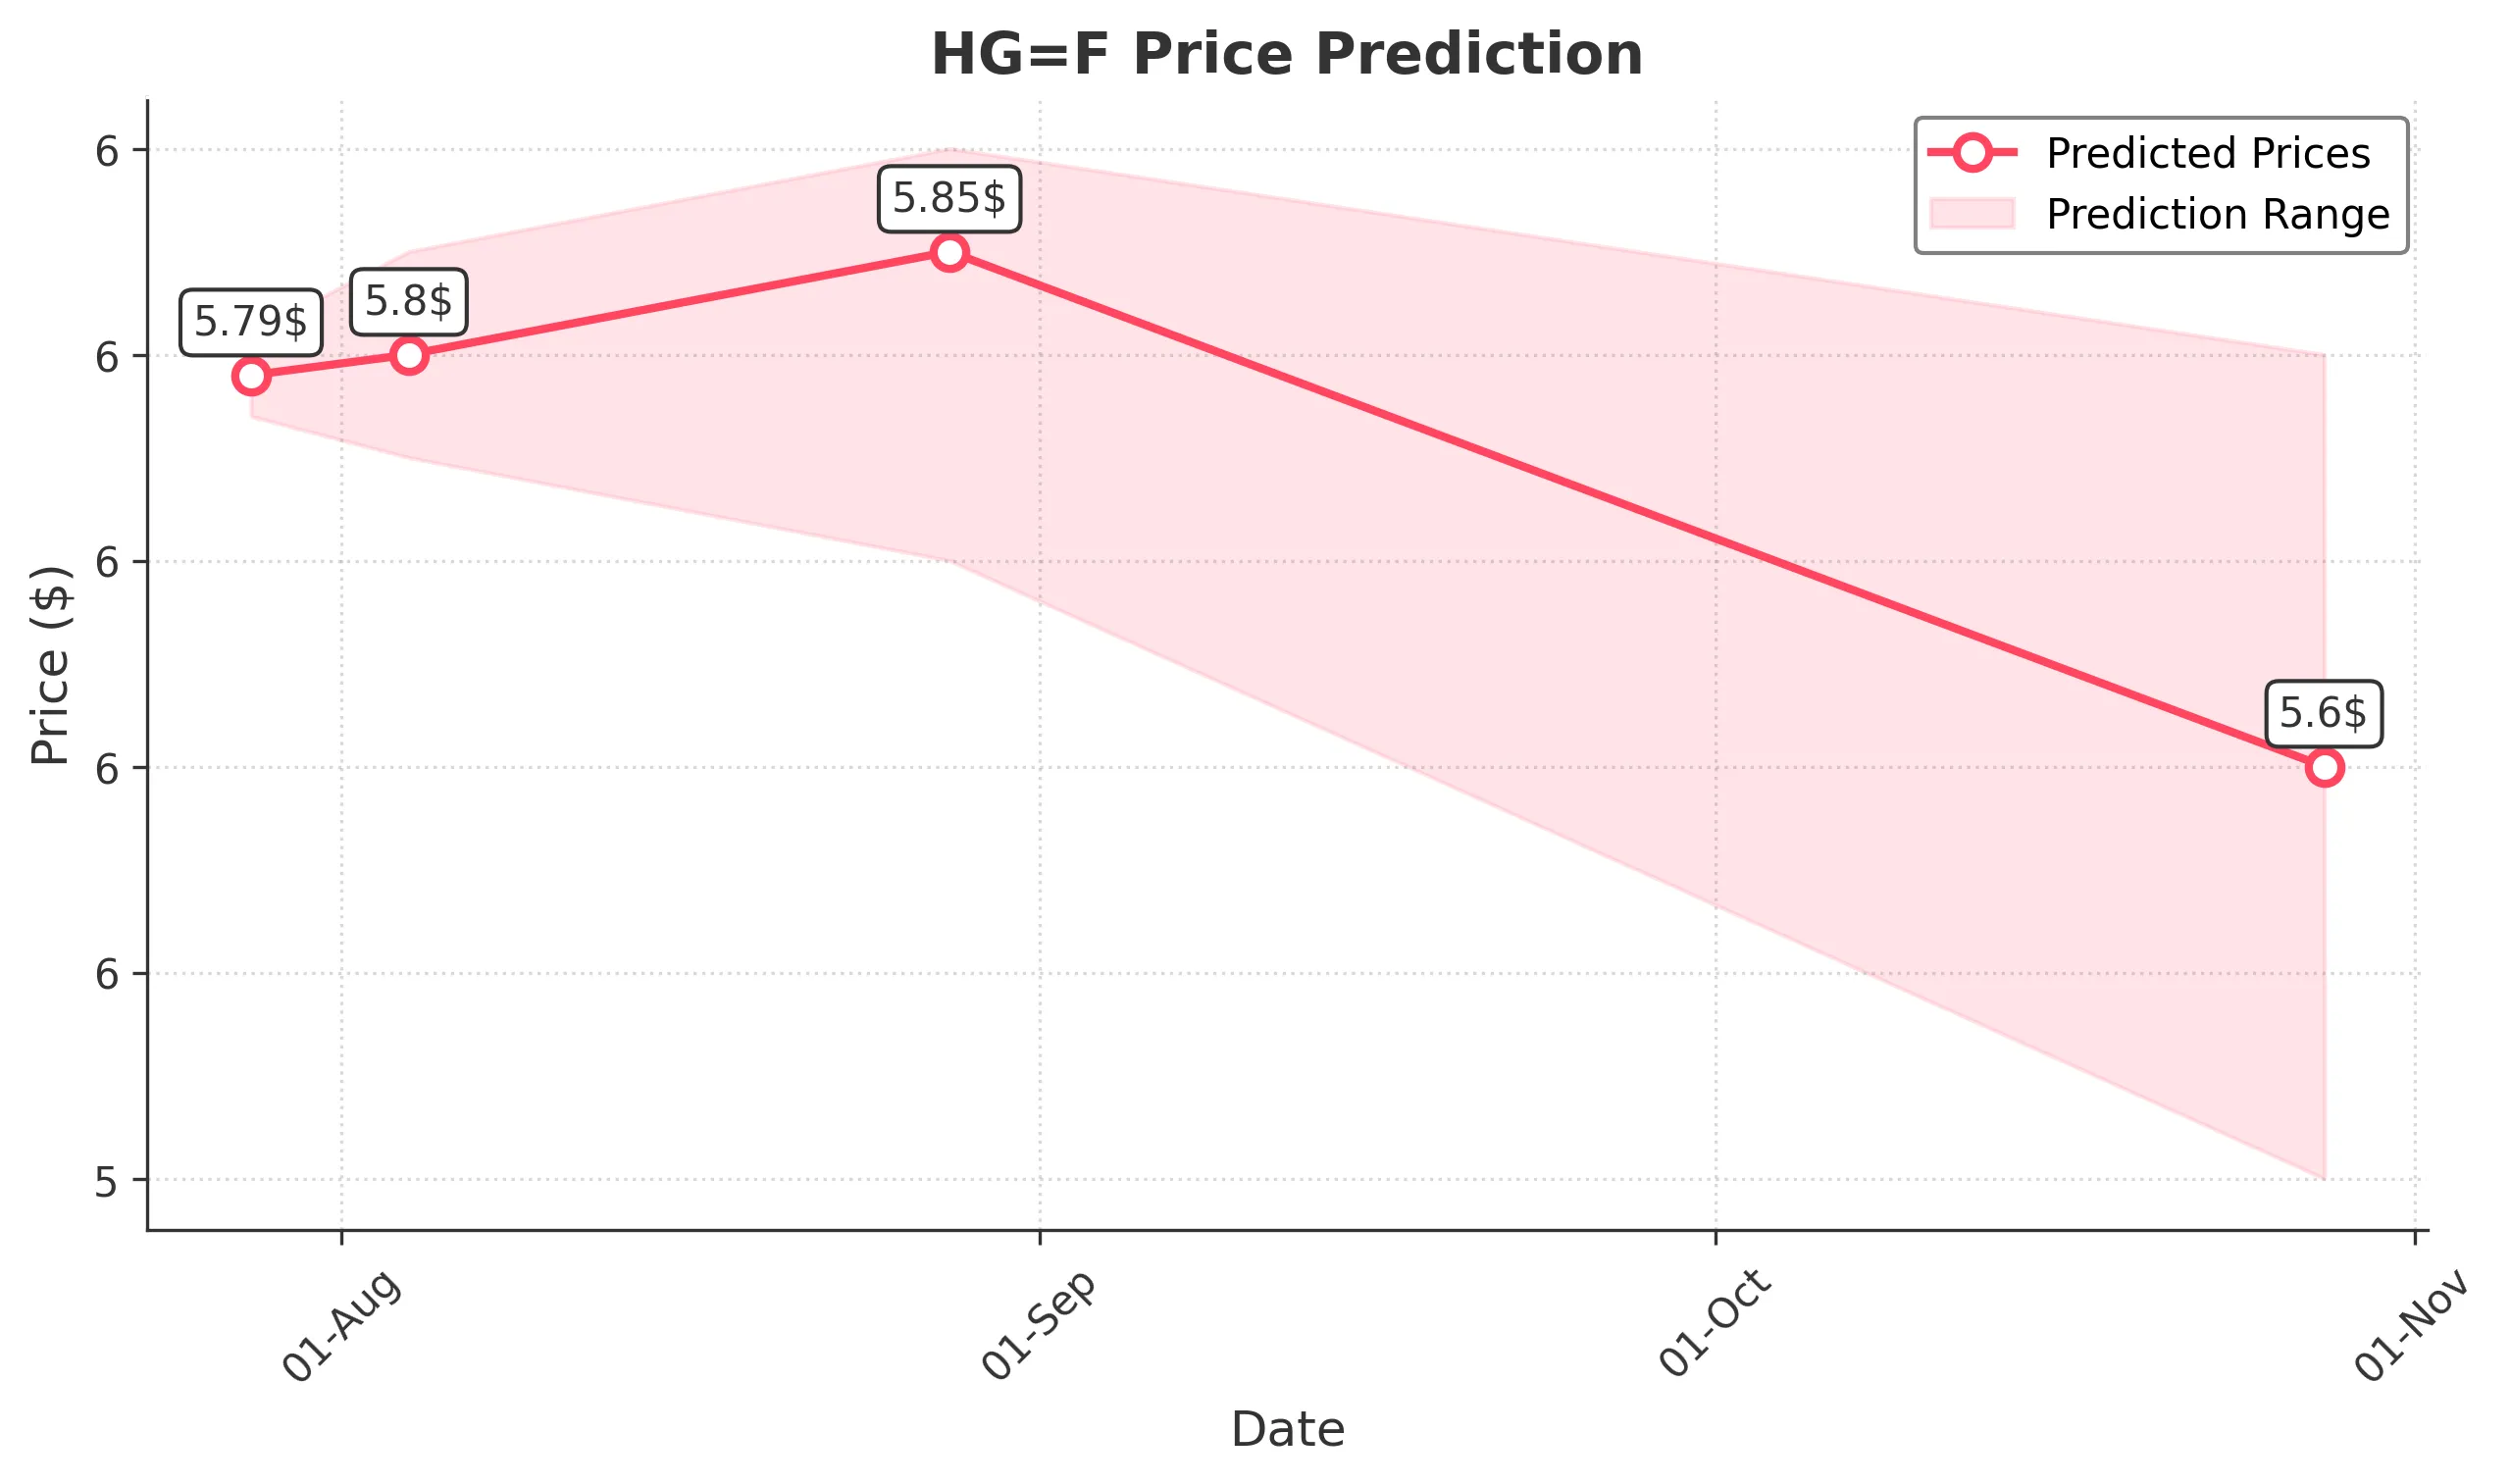
Target: July 28, 2025$5.79
$5.78
$5.81
$5.77
Description
The stock shows a slight bullish trend with a recent close above the 20-day moving average. RSI indicates overbought conditions, suggesting a potential pullback. Volume remains stable, indicating steady interest.
Analysis
Over the past 3 months, HG=F has shown a bullish trend, with significant support at 5.5000 and resistance around 5.8000. Recent candlestick patterns indicate bullish momentum, but RSI suggests caution due to overbought conditions.
Confidence Level
Potential Risks
Potential for a reversal due to overbought RSI and market sentiment shifts.
1 Week Prediction
Target: August 4, 2025$5.8
$5.79
$5.85
$5.75
Description
The stock is expected to maintain its upward trajectory, supported by recent bullish candlestick patterns. However, the MACD shows signs of potential divergence, indicating a possible slowdown in momentum.
Analysis
The stock has been trending upward, with key resistance at 5.8000. Volume patterns suggest healthy trading activity, but the recent high RSI indicates a risk of pullback. Overall, the outlook remains cautiously optimistic.
Confidence Level
Potential Risks
Market volatility and external economic factors could impact performance.
1 Month Prediction
Target: August 28, 2025$5.85
$5.8
$5.9
$5.7
Description
The stock is likely to consolidate around current levels, with potential for slight gains. Fibonacci retracement levels suggest resistance at 5.9000, while support remains at 5.7000. Market sentiment is mixed.
Analysis
The past three months show a strong bullish trend, but recent price action indicates a potential consolidation phase. Key support at 5.7000 and resistance at 5.9000 will be critical in determining future movements.
Confidence Level
Potential Risks
Uncertain macroeconomic conditions and potential profit-taking could lead to volatility.
3 Months Prediction
Target: October 28, 2025$5.6
$5.55
$5.8
$5.4
Description
A bearish outlook is anticipated as the stock may face downward pressure from macroeconomic factors and potential profit-taking. The 50-day moving average is trending downwards, indicating a shift in momentum.
Analysis
The stock has shown strong performance recently, but signs of weakening momentum and external economic pressures suggest a potential reversal. Key support at 5.4000 will be crucial in the coming months.
Confidence Level
Potential Risks
Economic downturns or negative news could exacerbate declines.