HGF Trading Predictions
1 Day Prediction
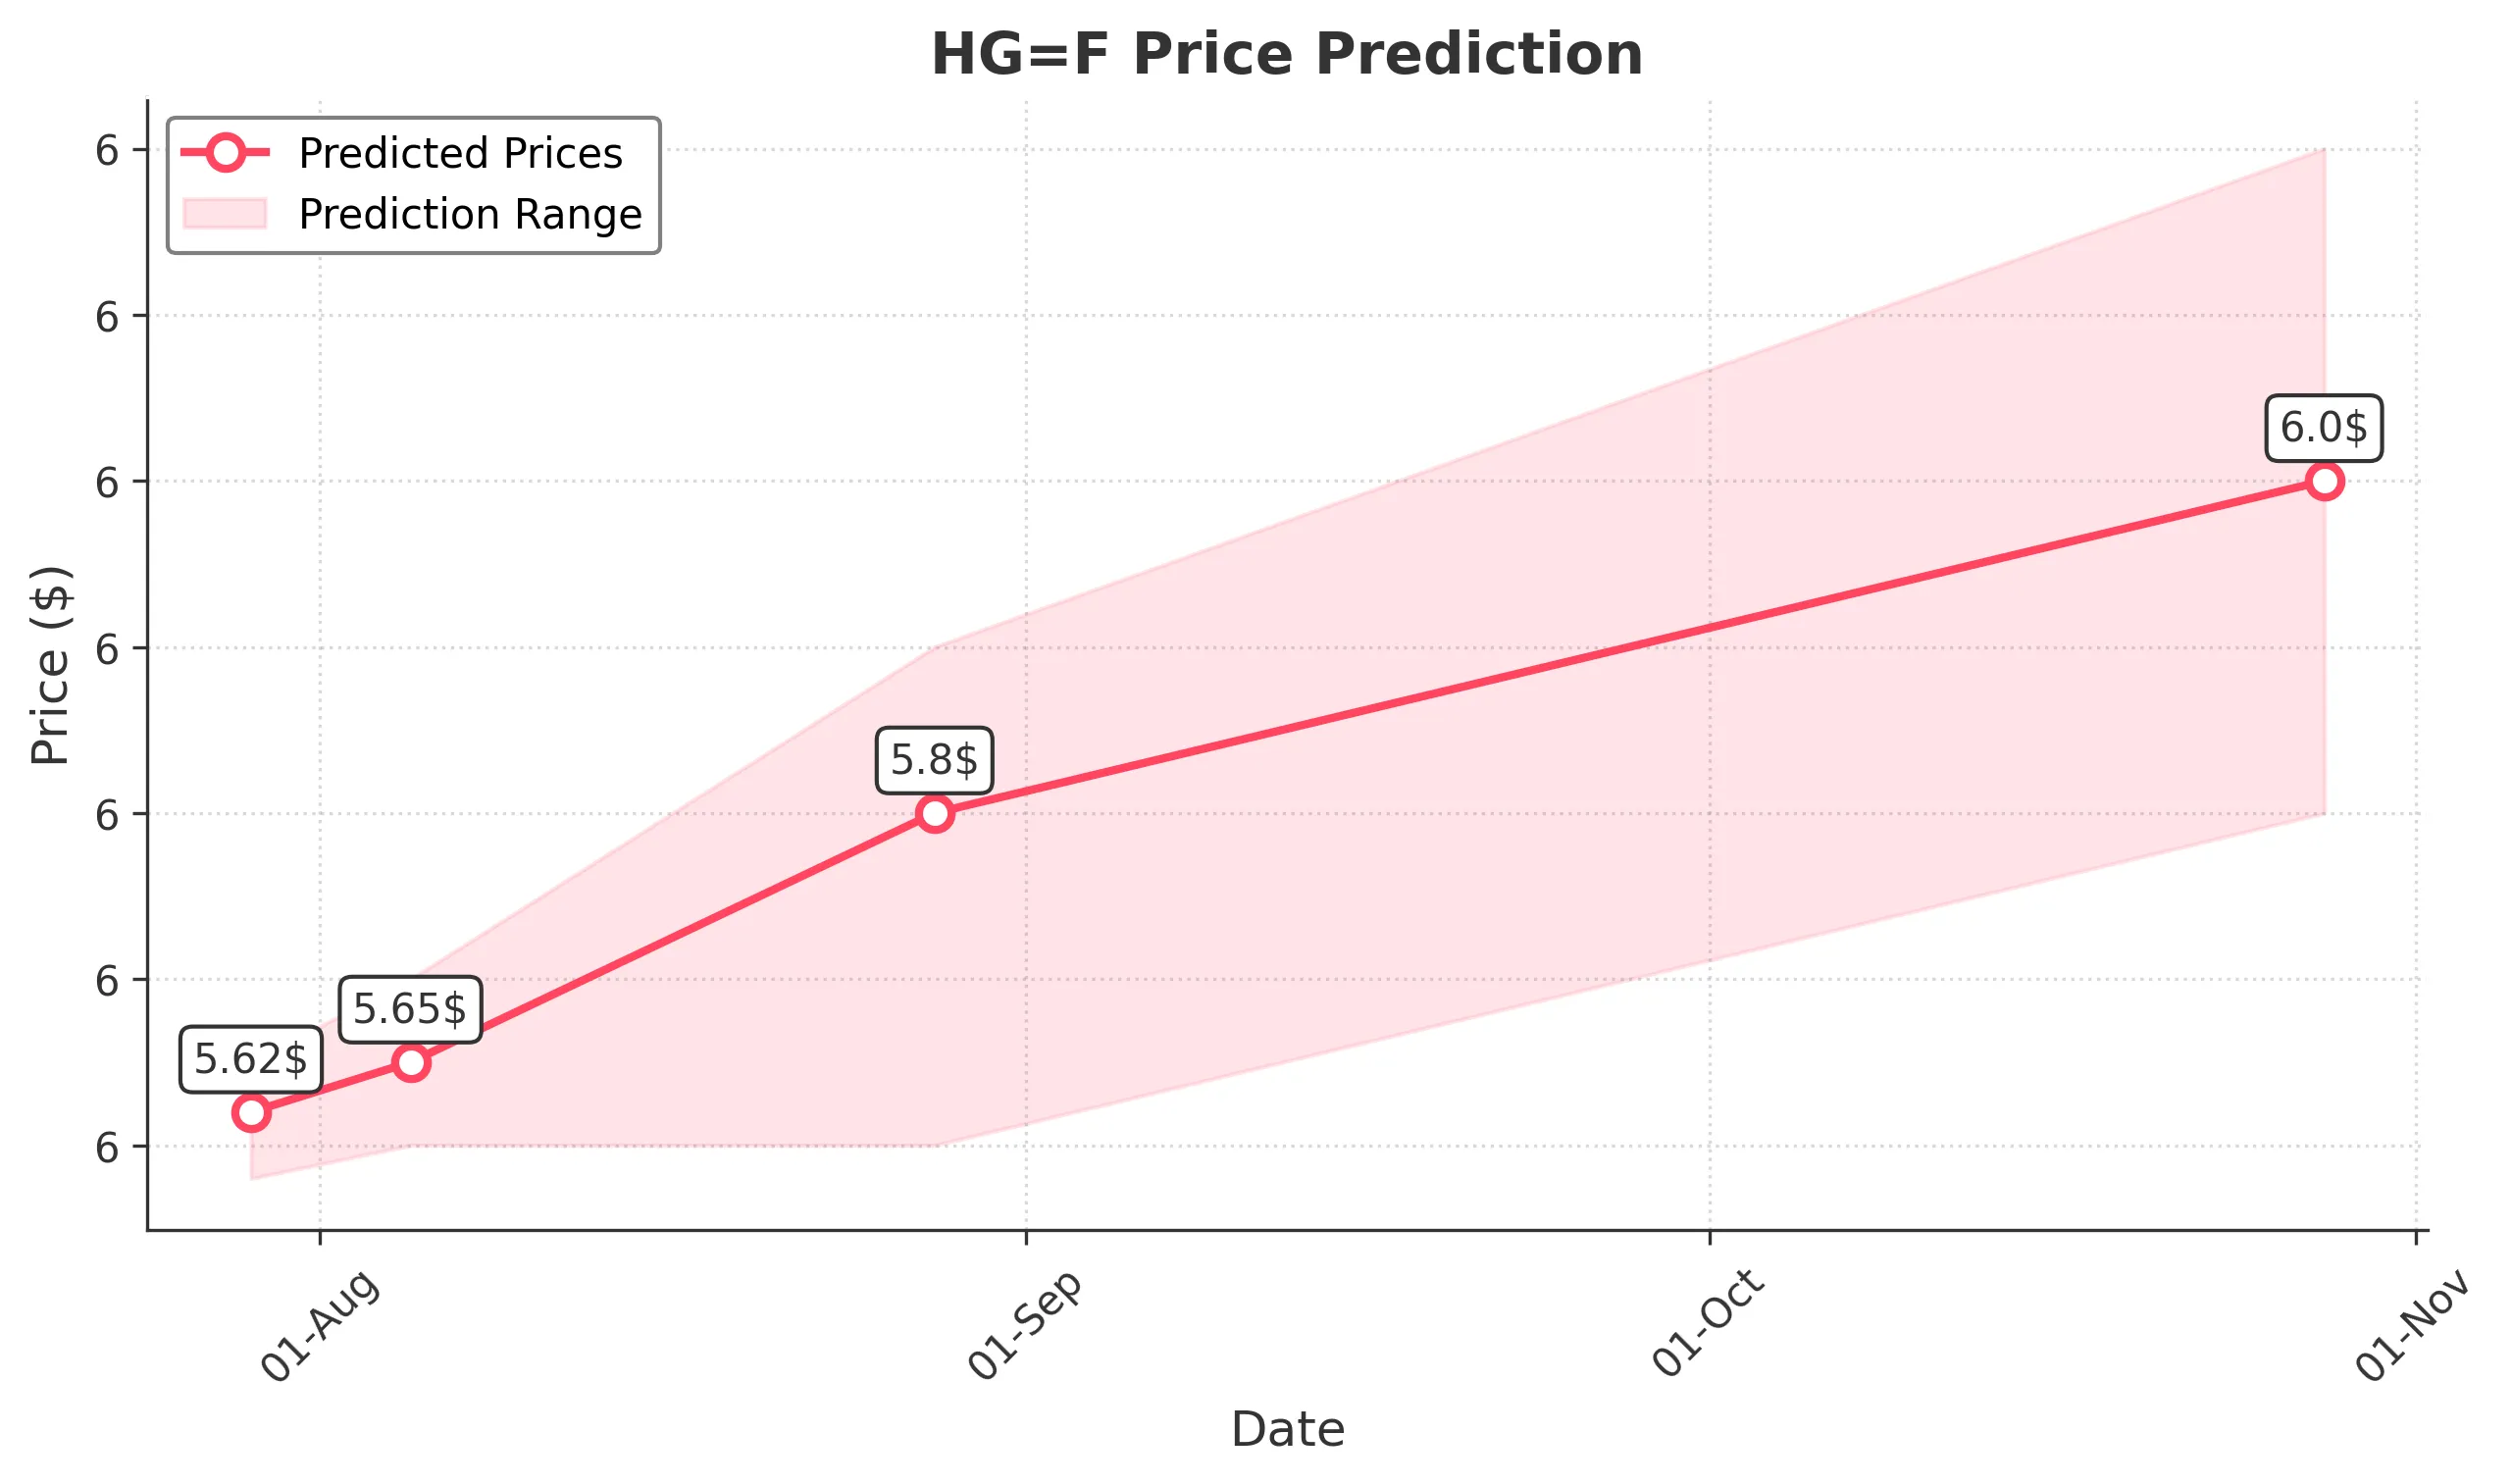
Target: July 29, 2025$5.62
$5.605
$5.65
$5.58
Description
The stock shows a slight bullish trend with a recent close above the 20-day moving average. RSI indicates a neutral position, while MACD suggests potential upward momentum. Volume is expected to increase as traders react to recent price movements.
Analysis
Over the past 3 months, HG=F has shown a bullish trend, with significant support at 5.50 and resistance around 5.80. The recent price action indicates a potential continuation of this trend, supported by positive volume spikes and bullish candlestick patterns.
Confidence Level
Potential Risks
Market volatility and external news could impact the price unexpectedly.
1 Week Prediction
Target: August 5, 2025$5.65
$5.62
$5.7
$5.6
Description
The stock is expected to maintain its upward trajectory, supported by bullish momentum indicators. The recent breakout above resistance levels suggests further gains, although overbought conditions may lead to short-term corrections.
Analysis
The stock has been trending upward, with key support at 5.60 and resistance at 5.80. Technical indicators like the MACD and RSI suggest bullish momentum, but caution is warranted due to potential overbought conditions.
Confidence Level
Potential Risks
Potential profit-taking and market corrections could lead to volatility.
1 Month Prediction
Target: August 28, 2025$5.8
$5.65
$5.9
$5.6
Description
The stock is likely to continue its upward trend, driven by strong market sentiment and positive technical indicators. However, the potential for a pullback exists if the price reaches overbought levels.
Analysis
The stock has shown a consistent bullish trend, with significant support at 5.60 and resistance at 5.90. Technical indicators suggest continued upward momentum, but caution is advised due to potential market corrections.
Confidence Level
Potential Risks
Market sentiment can shift rapidly, and external factors may influence price movements.
3 Months Prediction
Target: October 28, 2025$6
$5.8
$6.2
$5.8
Description
Long-term bullish sentiment is expected to drive the stock higher, supported by macroeconomic factors and positive technical indicators. However, potential market corrections could lead to volatility.
Analysis
The stock has shown a strong bullish trend over the past three months, with key support at 5.80 and resistance at 6.20. While technical indicators suggest continued upward momentum, external factors could introduce volatility.
Confidence Level
Potential Risks
Unforeseen macroeconomic events or changes in market sentiment could impact the prediction.