HGF Trading Predictions
1 Day Prediction
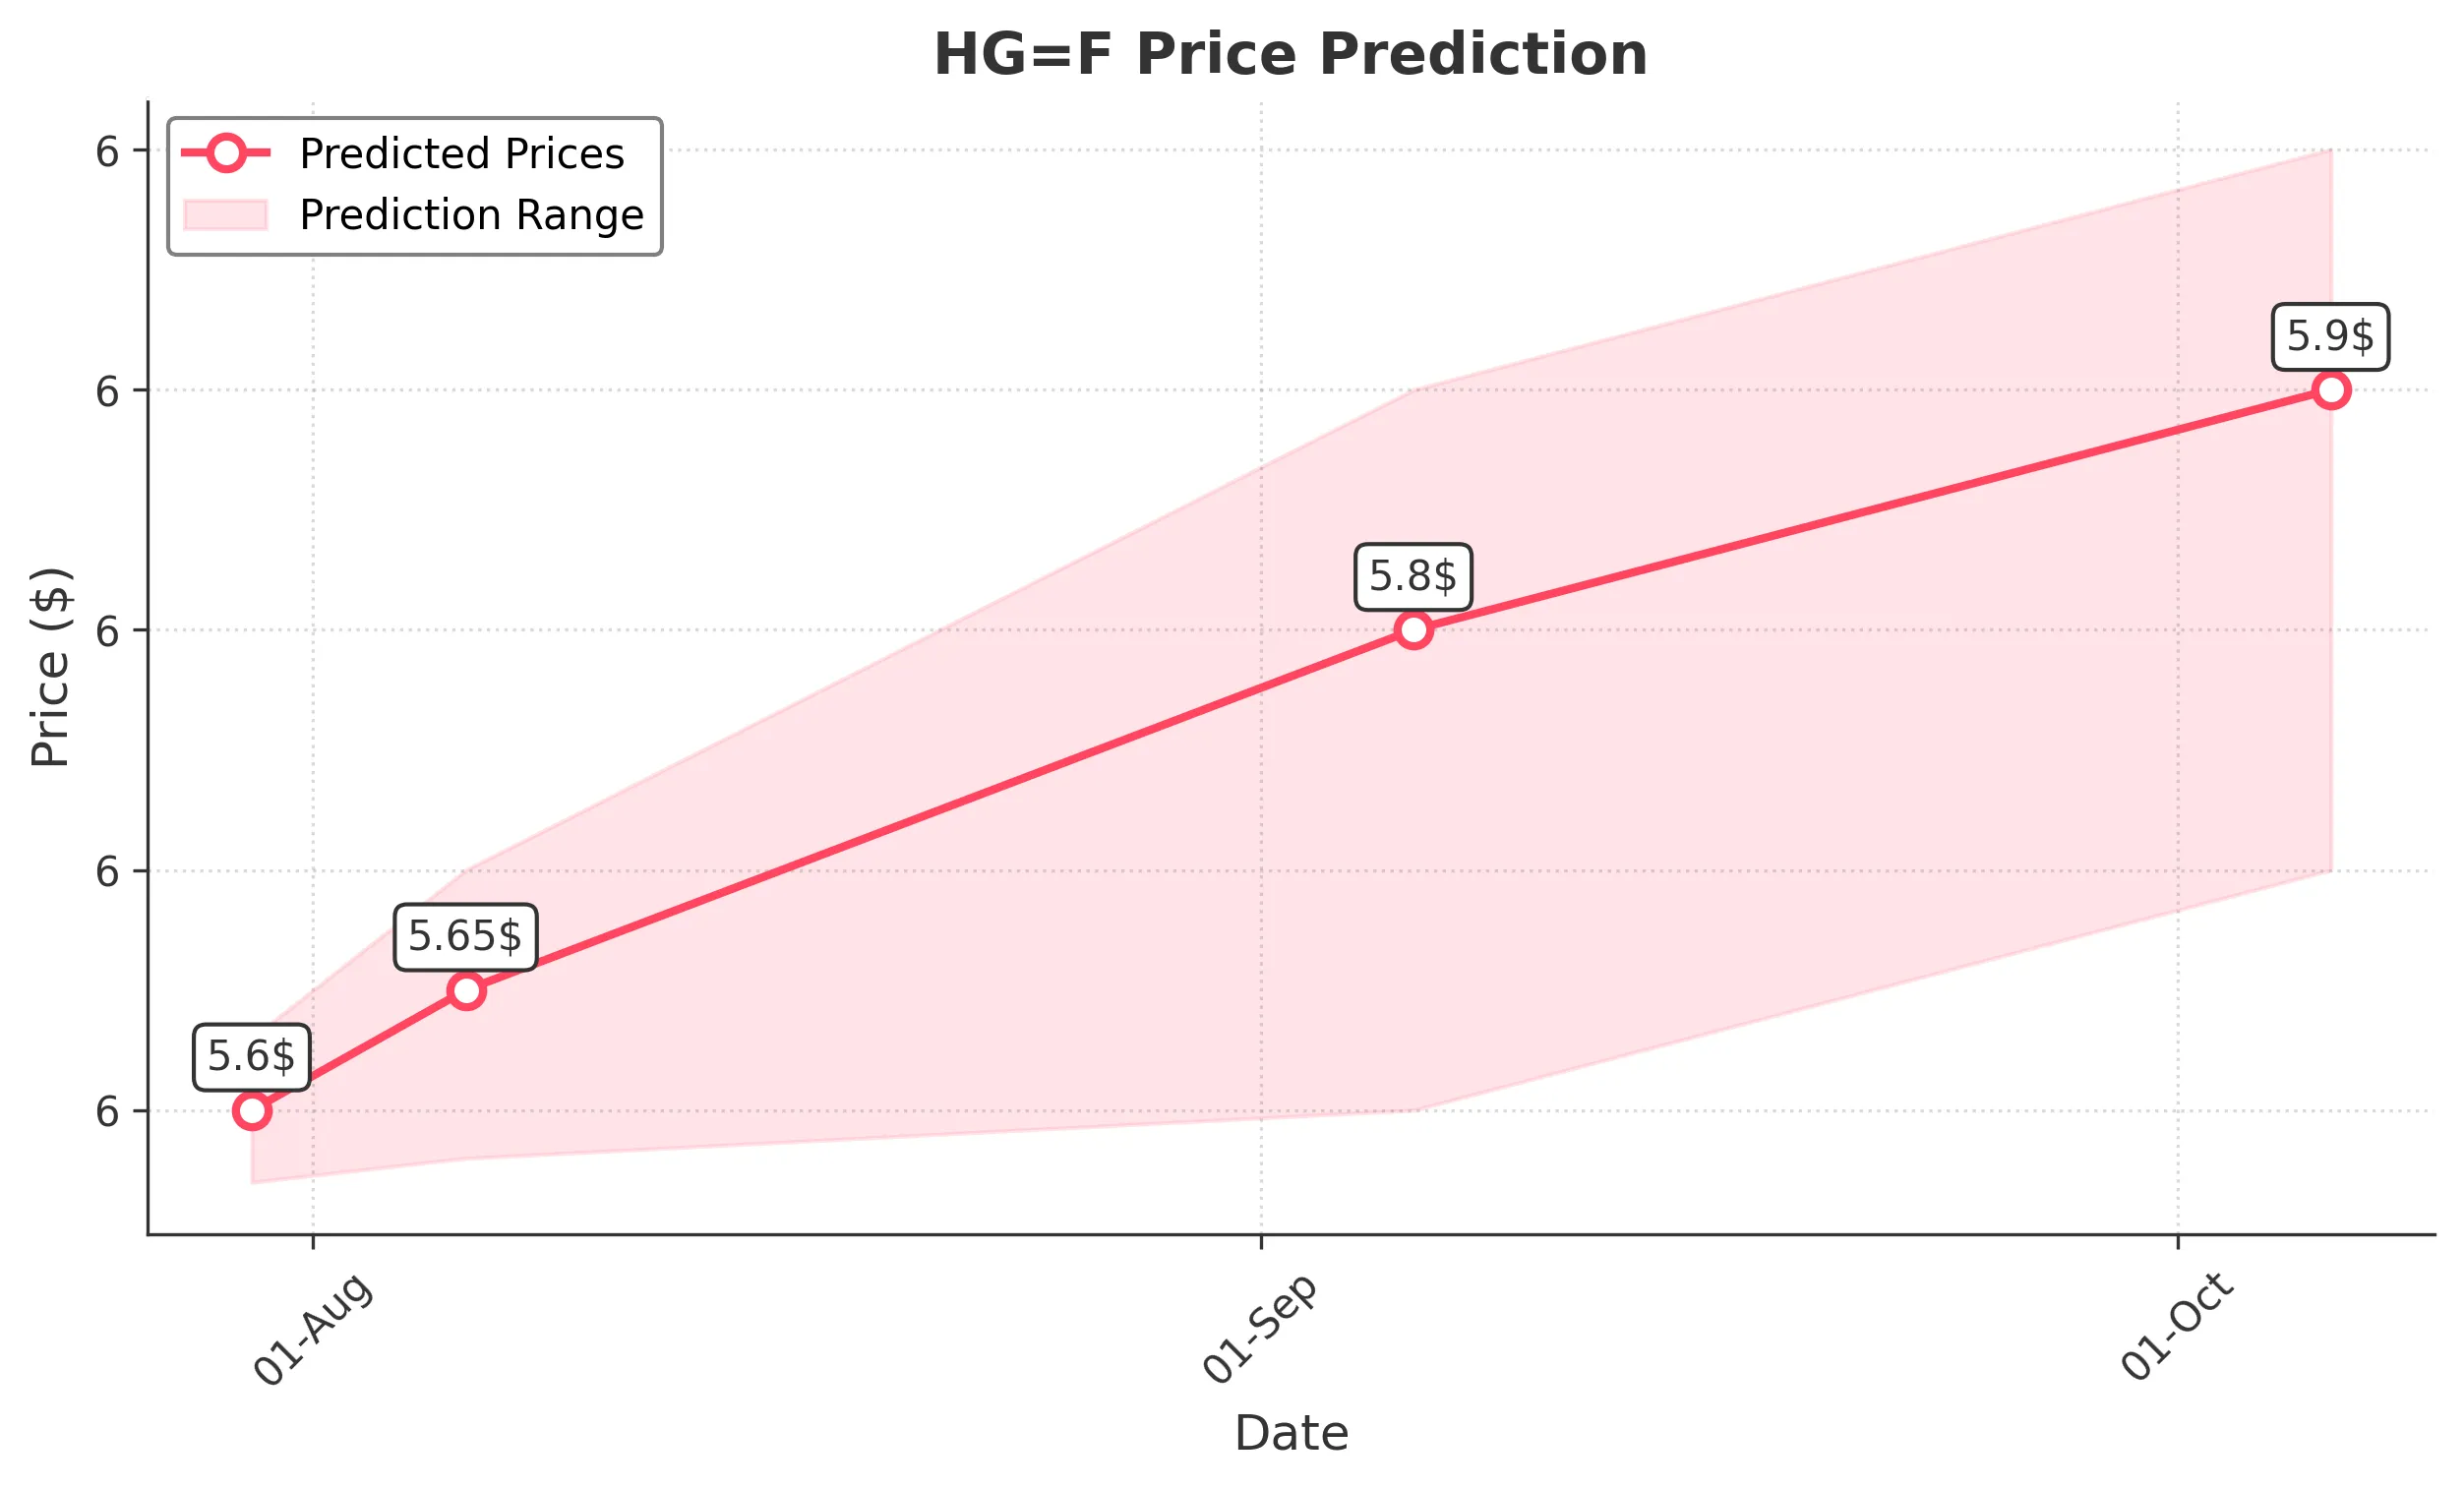
Target: July 30, 2025$5.6
$5.59
$5.63
$5.57
Description
The stock shows a slight bullish trend with a recent Doji candlestick indicating indecision. The RSI is near 60, suggesting room for upward movement. However, MACD is flattening, indicating potential resistance ahead.
Analysis
Over the past 3 months, HG=F has shown a bullish trend with significant support at 5.50 and resistance around 5.80. The recent increase in volume suggests strong buying interest, but the RSI indicates potential overbought conditions.
Confidence Level
Potential Risks
Market volatility and external news could impact the price. A sudden downturn in market sentiment may lead to a price drop.
1 Week Prediction
Target: August 6, 2025$5.65
$5.6
$5.7
$5.58
Description
The stock is expected to continue its upward trajectory, supported by a bullish MACD crossover. However, the RSI nearing 70 indicates potential overbought conditions, which could lead to a pullback.
Analysis
The stock has been in a bullish phase, with key support at 5.50 and resistance at 5.80. The recent price action shows a strong upward momentum, but caution is advised as the market sentiment can shift quickly.
Confidence Level
Potential Risks
Potential market corrections or negative news could reverse the trend. Watch for volume spikes that may indicate selling pressure.
1 Month Prediction
Target: September 6, 2025$5.8
$5.7
$5.9
$5.6
Description
The stock is likely to reach new highs as bullish momentum continues. The Fibonacci retracement levels suggest a target around 5.80. However, the RSI indicates potential overbought conditions, warranting caution.
Analysis
The stock has shown a strong bullish trend, with significant support at 5.50 and resistance at 5.80. The volume has been increasing, indicating strong buying interest, but the market remains sensitive to external factors.
Confidence Level
Potential Risks
Market corrections or geopolitical events could impact the price. A reversal pattern could emerge if selling pressure increases.
3 Months Prediction
Target: October 6, 2025$5.9
$5.8
$6
$5.7
Description
The stock is expected to maintain its upward trend, potentially reaching 6.00. However, the RSI suggests it may be overbought, indicating a possible correction. Watch for volume trends to confirm strength.
Analysis
The stock has been in a bullish trend, with key support at 5.50 and resistance at 6.00. The recent price action shows strong momentum, but the market remains sensitive to external factors, and a correction could occur.
Confidence Level
Potential Risks
Unforeseen market events or economic data releases could lead to volatility. A bearish reversal pattern could emerge if selling pressure increases.