HGF Trading Predictions
1 Day Prediction
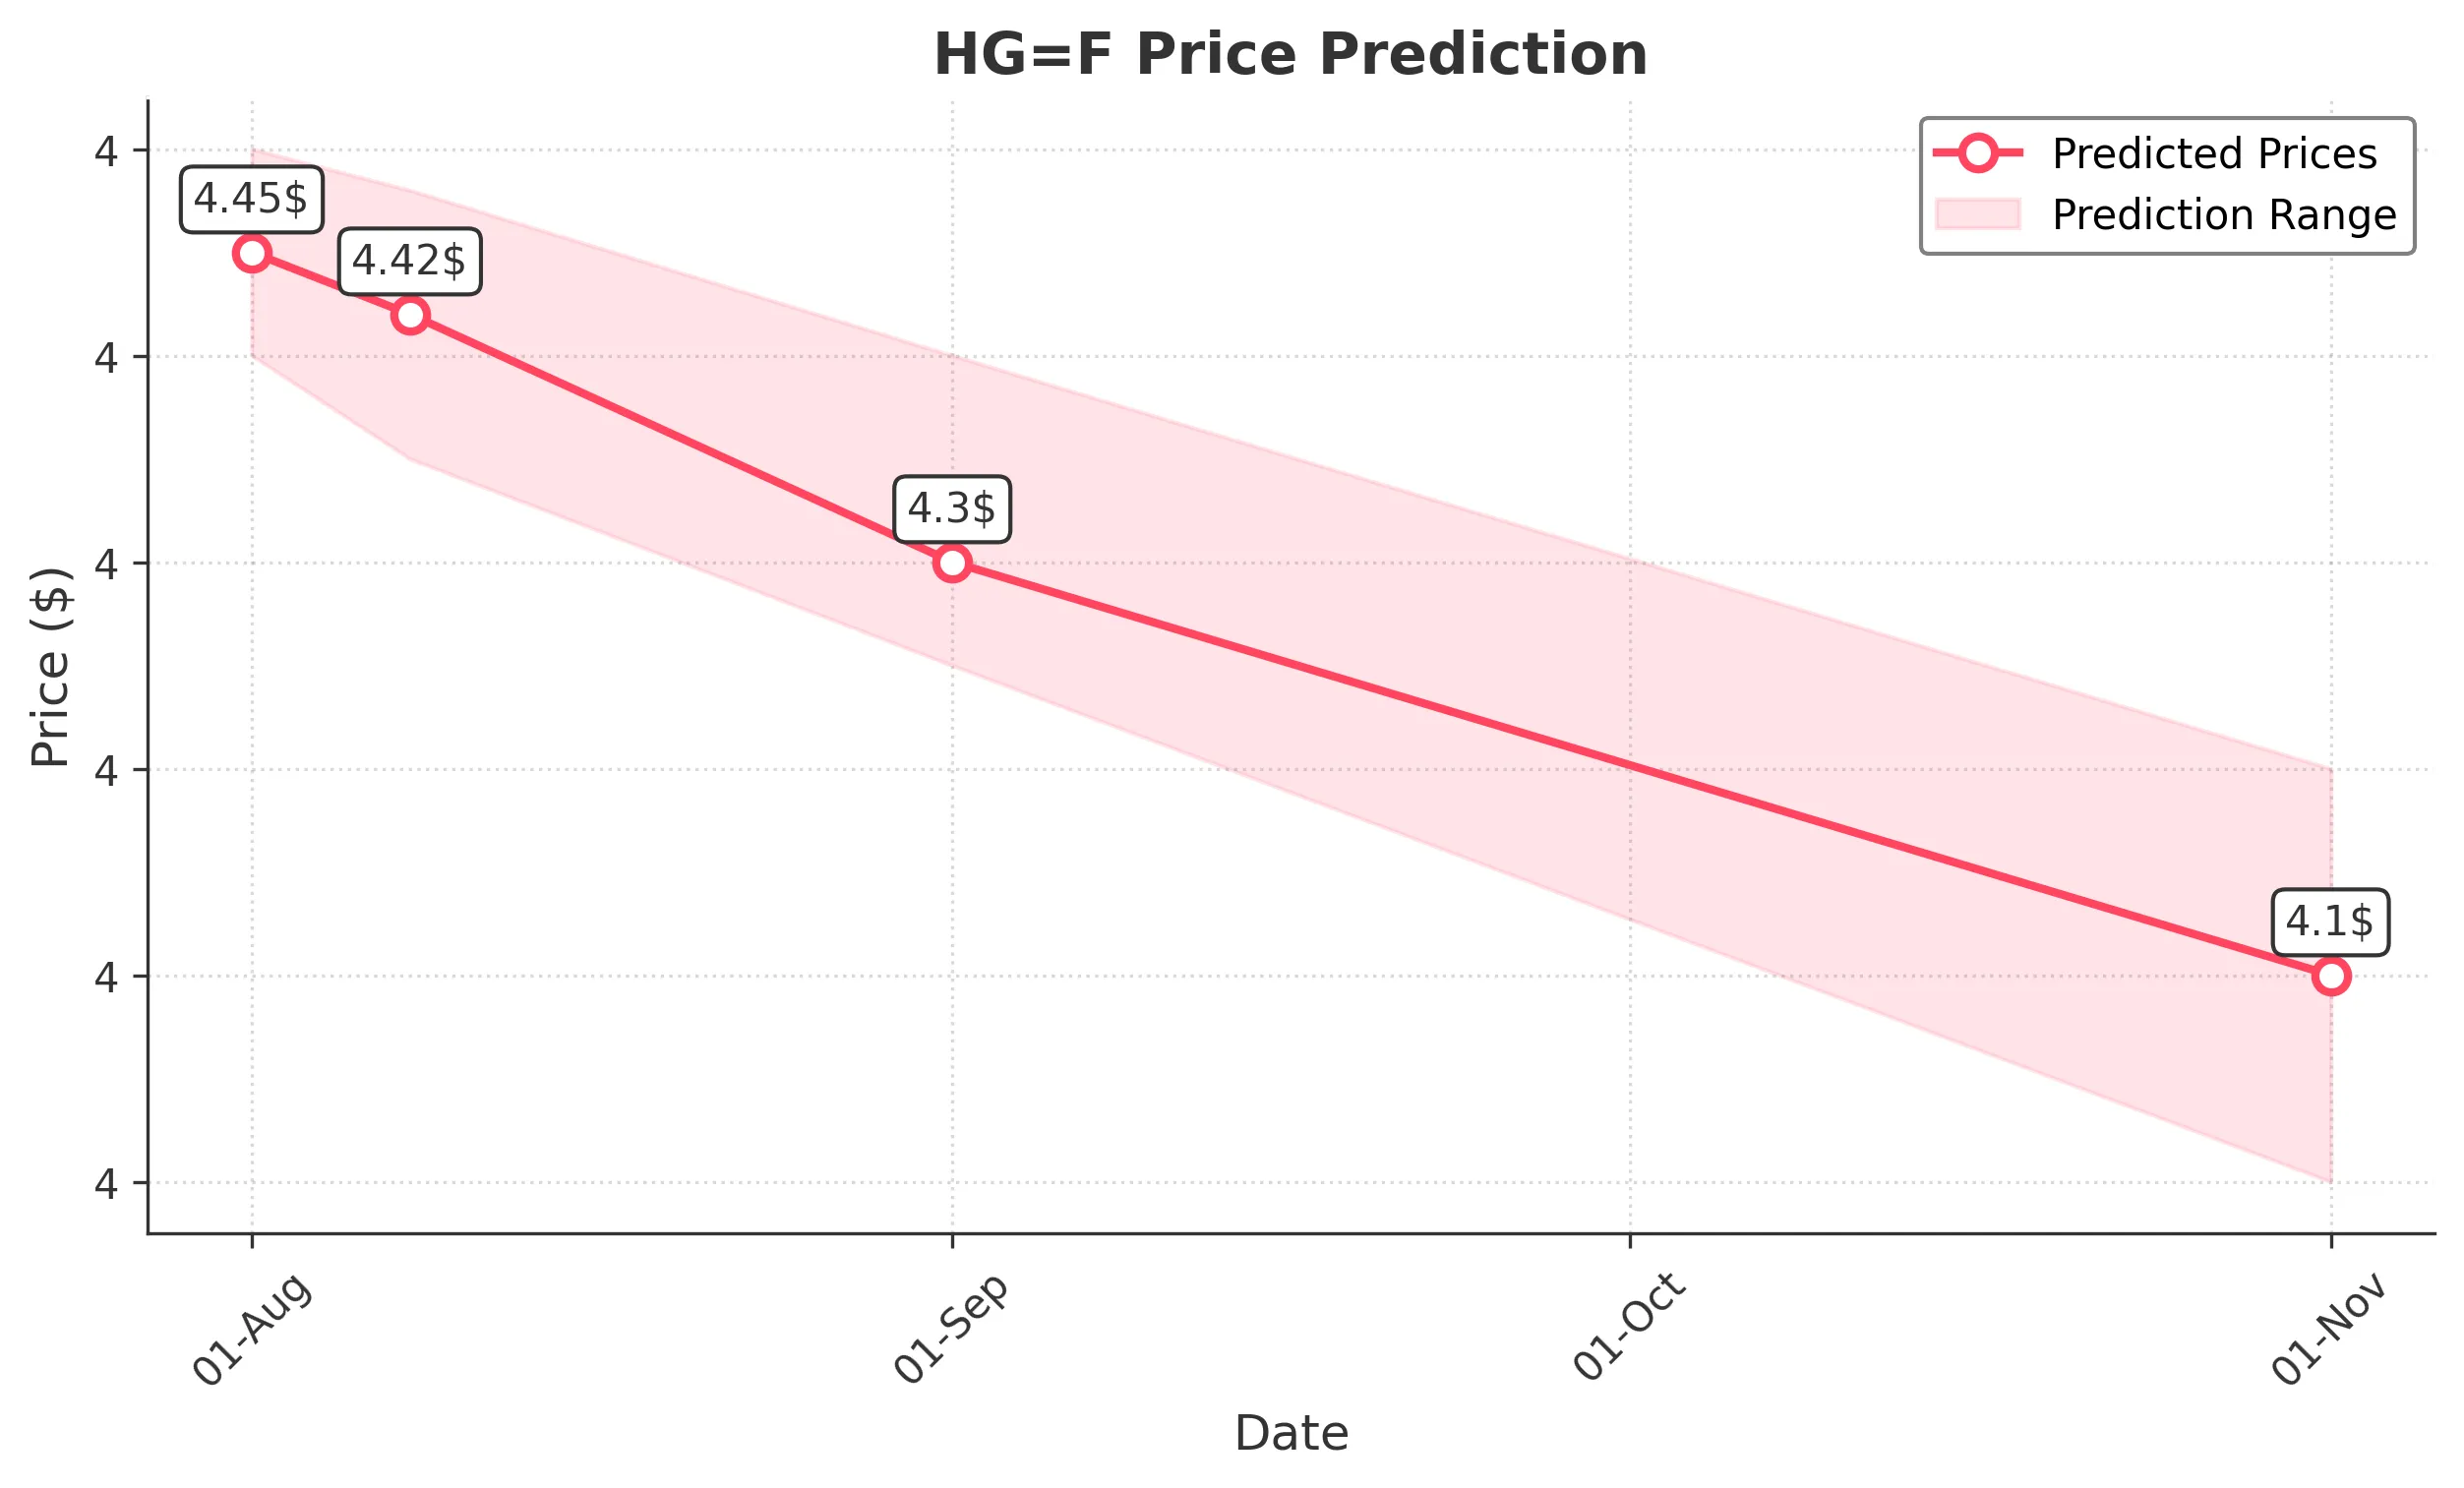
Target: August 1, 2025$4.45
$4.44
$4.5
$4.4
Description
The stock shows bearish momentum with a recent drop in price and a close below the 50-day moving average. RSI indicates oversold conditions, but a potential bounce is limited by resistance at 4.5000. Volume spikes suggest selling pressure.
Analysis
Over the past 3 months, HG=F has shown a bullish trend until recently, with significant resistance at 5.8000. The recent drop indicates a bearish reversal, with support at 4.4000. Technical indicators like MACD and RSI suggest potential further declines.
Confidence Level
Potential Risks
Market volatility and external news could impact the price significantly.
1 Week Prediction
Target: August 8, 2025$4.42
$4.4
$4.48
$4.35
Description
The bearish trend is expected to continue, with potential for a slight recovery. The stock is likely to test support levels around 4.3500. Volume analysis indicates continued selling pressure, limiting upward movement.
Analysis
The stock has faced downward pressure recently, breaking below key support levels. The 50-day moving average is trending downwards, and the RSI indicates bearish momentum. Volume patterns suggest a lack of buying interest.
Confidence Level
Potential Risks
Unforeseen macroeconomic events could lead to volatility and affect the prediction.
1 Month Prediction
Target: September 1, 2025$4.3
$4.35
$4.4
$4.25
Description
Continued bearish sentiment is expected, with the stock likely to test lower support levels. The MACD indicates a bearish crossover, and the RSI remains in oversold territory, suggesting further declines.
Analysis
The stock has been in a downtrend, with significant resistance at 4.5000. Technical indicators suggest a bearish outlook, with potential for further declines. Volume analysis shows a lack of buying interest, indicating weak demand.
Confidence Level
Potential Risks
Market sentiment and external factors could lead to unexpected price movements.
3 Months Prediction
Target: November 1, 2025$4.1
$4.15
$4.2
$4
Description
The stock is expected to continue its bearish trend, potentially reaching lower support levels. The overall market sentiment remains negative, and technical indicators suggest a lack of bullish momentum.
Analysis
The stock has shown a consistent downtrend, with significant resistance at 4.5000. The MACD and RSI indicate bearish momentum, and volume patterns suggest weak buying interest. External economic factors may further influence price movements.
Confidence Level
Potential Risks
Potential market reversals or positive news could alter the bearish outlook.