HGF Trading Predictions
1 Day Prediction
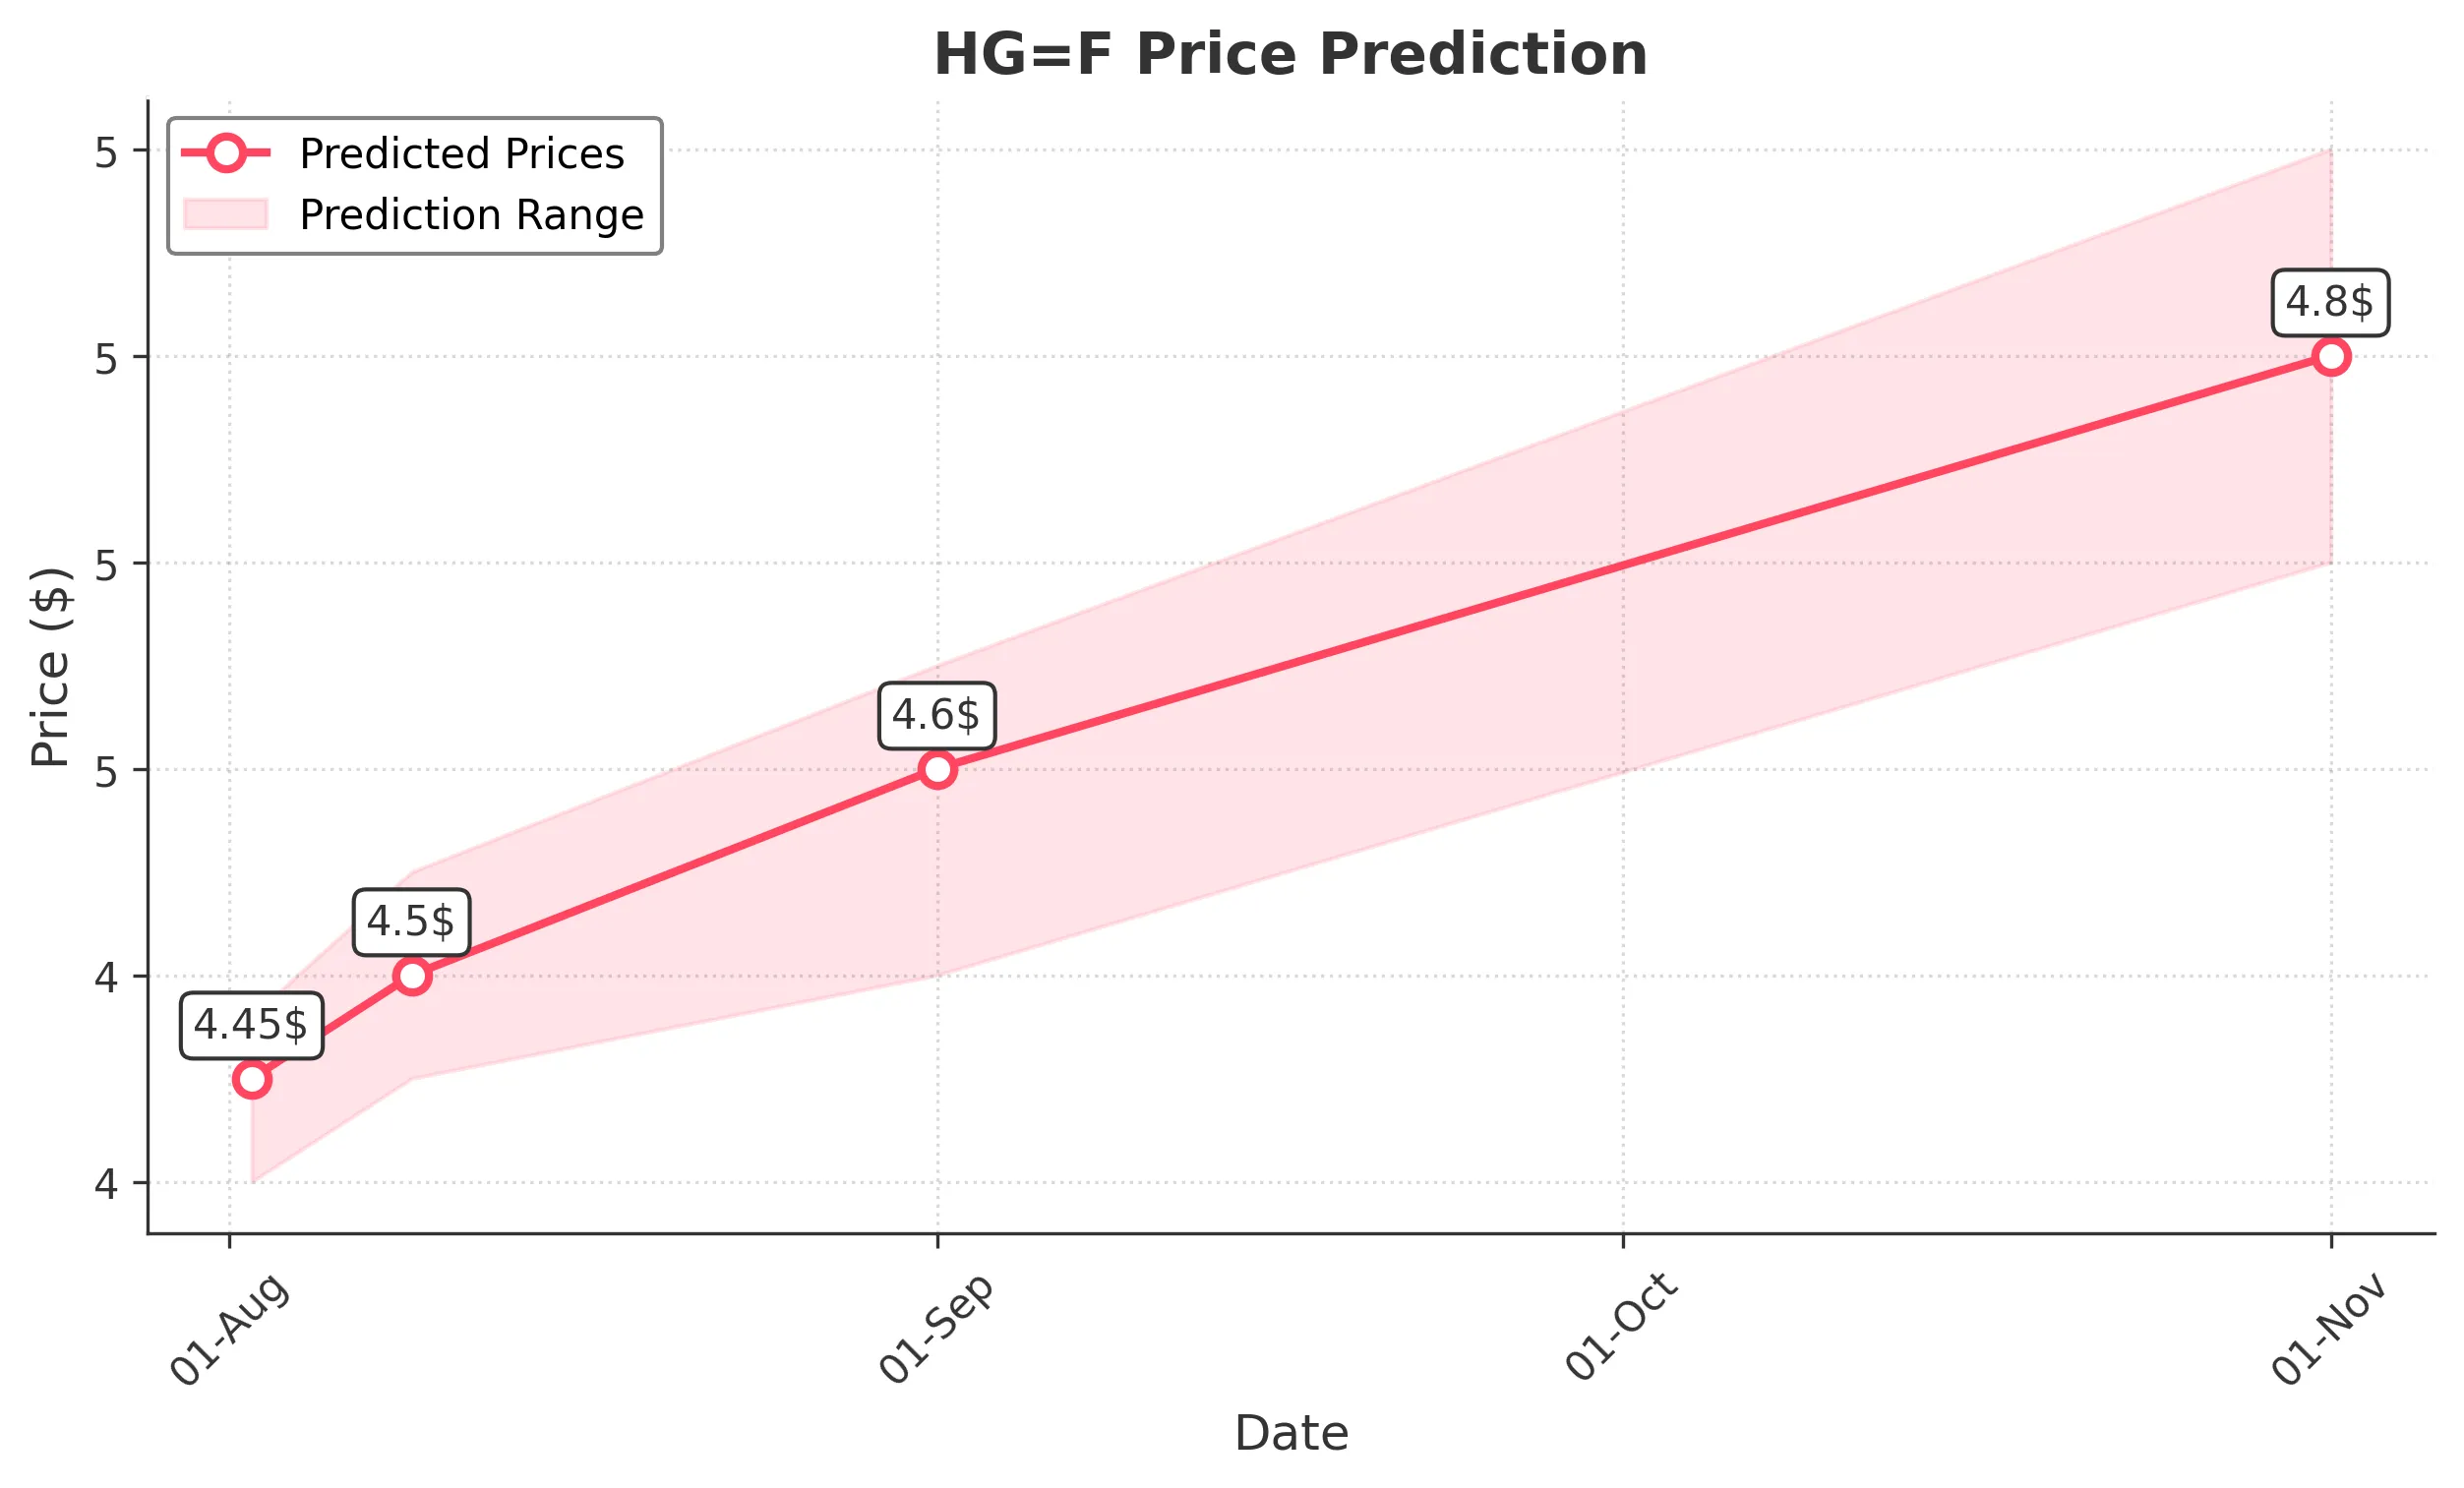
Target: August 2, 2025$4.45
$4.43
$4.48
$4.4
Description
The stock shows a bearish trend with a recent drop in price. RSI indicates oversold conditions, suggesting a potential short-term rebound. However, the overall sentiment remains cautious due to recent volatility.
Analysis
Over the past 3 months, HG=F has shown a bearish trend, especially with the recent drop below key support levels. The RSI is approaching oversold territory, indicating a possible short-term bounce, but overall market sentiment remains cautious.
Confidence Level
Potential Risks
Market volatility and potential news could impact the price unexpectedly.
1 Week Prediction
Target: August 9, 2025$4.5
$4.46
$4.55
$4.45
Description
A slight recovery is expected as the stock may find support around the 4.45 level. The MACD shows a potential bullish crossover, but caution is advised due to recent bearish momentum.
Analysis
The stock has been in a downtrend, with significant resistance at 4.60. Volume has been inconsistent, and while there are signs of potential recovery, the overall bearish sentiment could limit upward movement.
Confidence Level
Potential Risks
Unforeseen market events or economic data releases could lead to further declines.
1 Month Prediction
Target: September 1, 2025$4.6
$4.55
$4.65
$4.5
Description
Expect a gradual recovery as the stock stabilizes around the 4.60 level. The Bollinger Bands suggest a potential breakout, but the overall market sentiment remains mixed.
Analysis
The stock has faced significant resistance and volatility. While there are signs of stabilization, the overall trend remains uncertain. Key support at 4.50 and resistance at 4.60 will be crucial in determining future movements.
Confidence Level
Potential Risks
Economic indicators and market sentiment could shift, impacting the recovery.
3 Months Prediction
Target: November 1, 2025$4.8
$4.75
$4.9
$4.7
Description
A potential bullish reversal is anticipated as the stock may break above resistance levels. The MACD and moving averages suggest a shift in momentum, but caution is warranted due to external market factors.
Analysis
The stock has shown signs of recovery potential, but the overall trend remains uncertain. Key resistance levels will need to be broken for a sustained upward movement. External economic factors could significantly influence performance.
Confidence Level
Potential Risks
Market volatility and economic conditions could hinder recovery efforts.