HGF Trading Predictions
1 Day Prediction
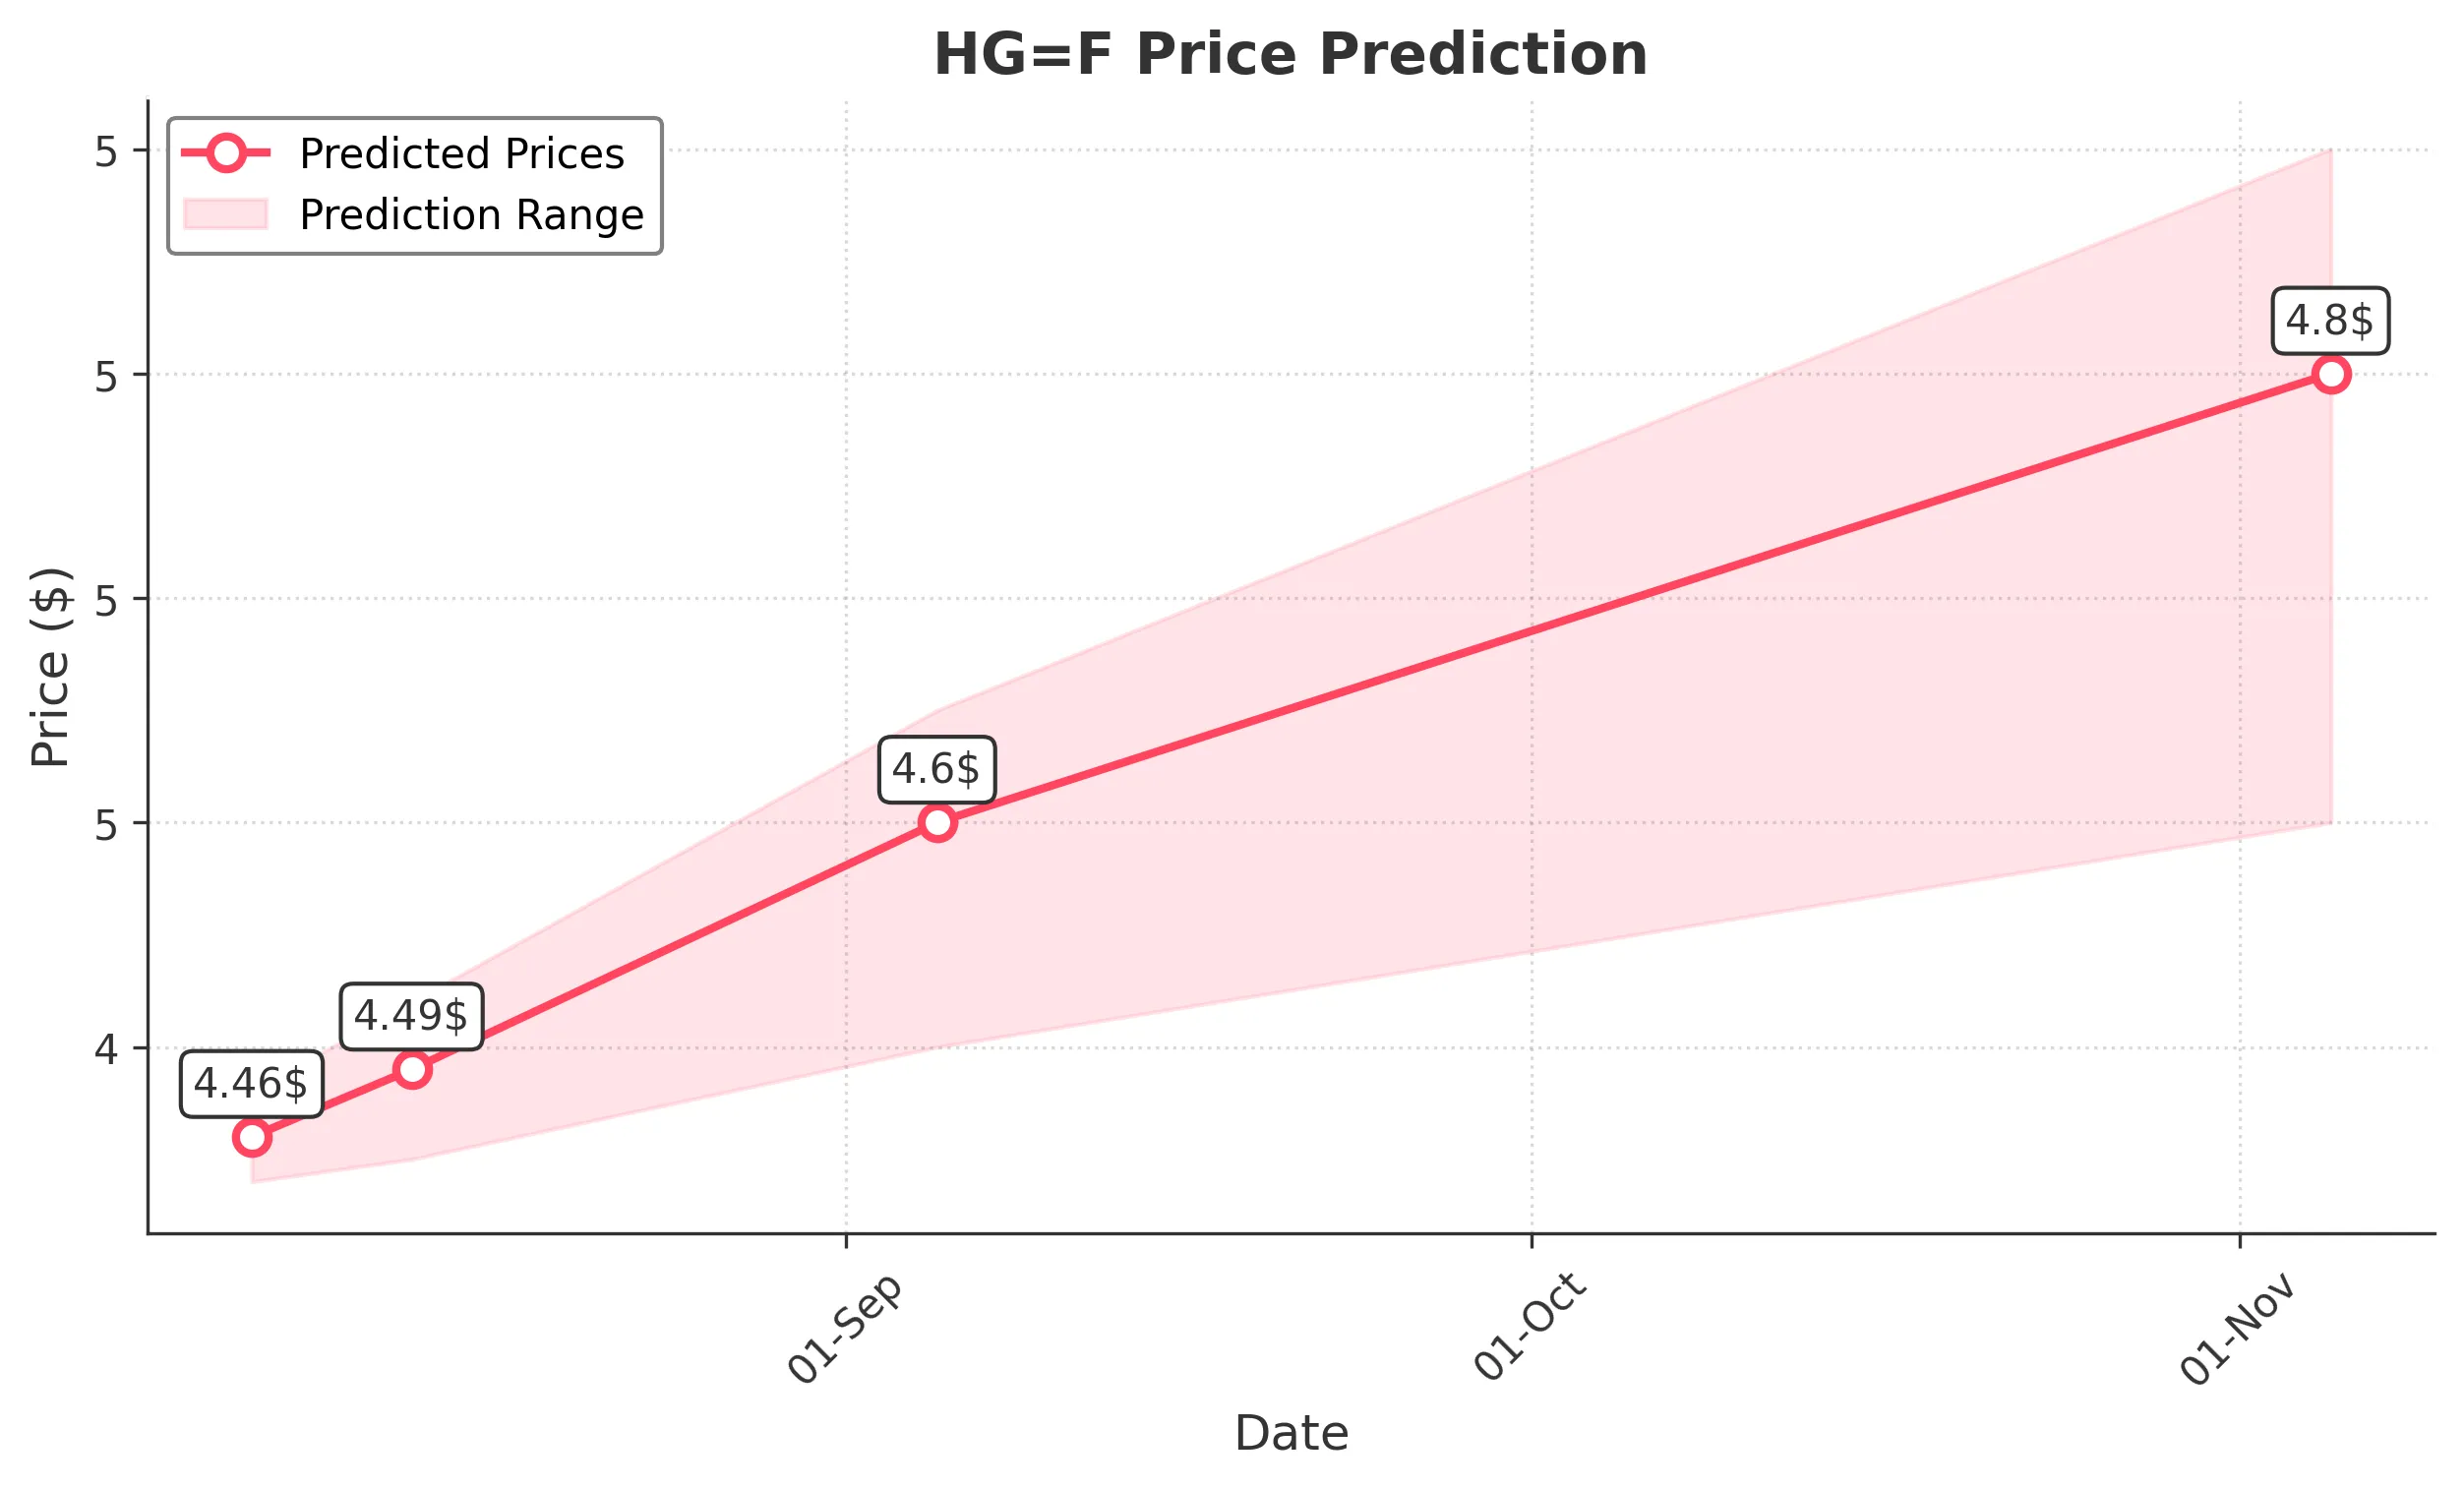
Target: August 6, 2025$4.46
$4.455
$4.48
$4.44
Description
The stock shows a slight bullish trend with a recent Doji candlestick indicating indecision. RSI is near neutral, suggesting potential for upward movement. However, recent volatility and lower volume may limit gains.
Analysis
Over the past 3 months, HG=F has shown a bearish trend with significant fluctuations. Key support at 4.33 and resistance at 5.80. Recent volume spikes indicate increased interest, but the overall trend remains uncertain.
Confidence Level
Potential Risks
Market sentiment is mixed, and external factors could lead to sudden price changes.
1 Week Prediction
Target: August 13, 2025$4.49
$4.46
$4.52
$4.45
Description
The stock may see a slight recovery as it approaches a Fibonacci retracement level. However, the MACD shows bearish divergence, indicating potential downward pressure. Volume trends suggest cautious optimism.
Analysis
The stock has been in a bearish phase, with recent attempts to recover. Key resistance at 4.80 and support at 4.33. Technical indicators show mixed signals, with RSI indicating potential overbought conditions.
Confidence Level
Potential Risks
Potential for reversal exists, especially if market sentiment shifts negatively.
1 Month Prediction
Target: September 5, 2025$4.6
$4.49
$4.65
$4.5
Description
A gradual upward trend is expected as the stock approaches key support levels. The Bollinger Bands indicate potential for a breakout, but caution is advised due to recent volatility.
Analysis
The stock has shown volatility with a bearish trend recently. Key support at 4.33 and resistance at 5.80. Technical indicators suggest a potential reversal, but overall market sentiment remains cautious.
Confidence Level
Potential Risks
Market conditions and external economic factors could impact the stock's performance significantly.
3 Months Prediction
Target: November 5, 2025$4.8
$4.7
$4.9
$4.6
Description
Long-term outlook suggests a recovery as the stock stabilizes above key support levels. Positive market sentiment and potential macroeconomic improvements could drive prices higher.
Analysis
The stock has been in a bearish trend but shows signs of potential recovery. Key resistance at 5.80 and support at 4.33. Technical indicators suggest a cautious bullish outlook, but external factors remain a risk.
Confidence Level
Potential Risks
Unforeseen economic events or changes in market sentiment could lead to volatility.