HGF Trading Predictions
1 Day Prediction
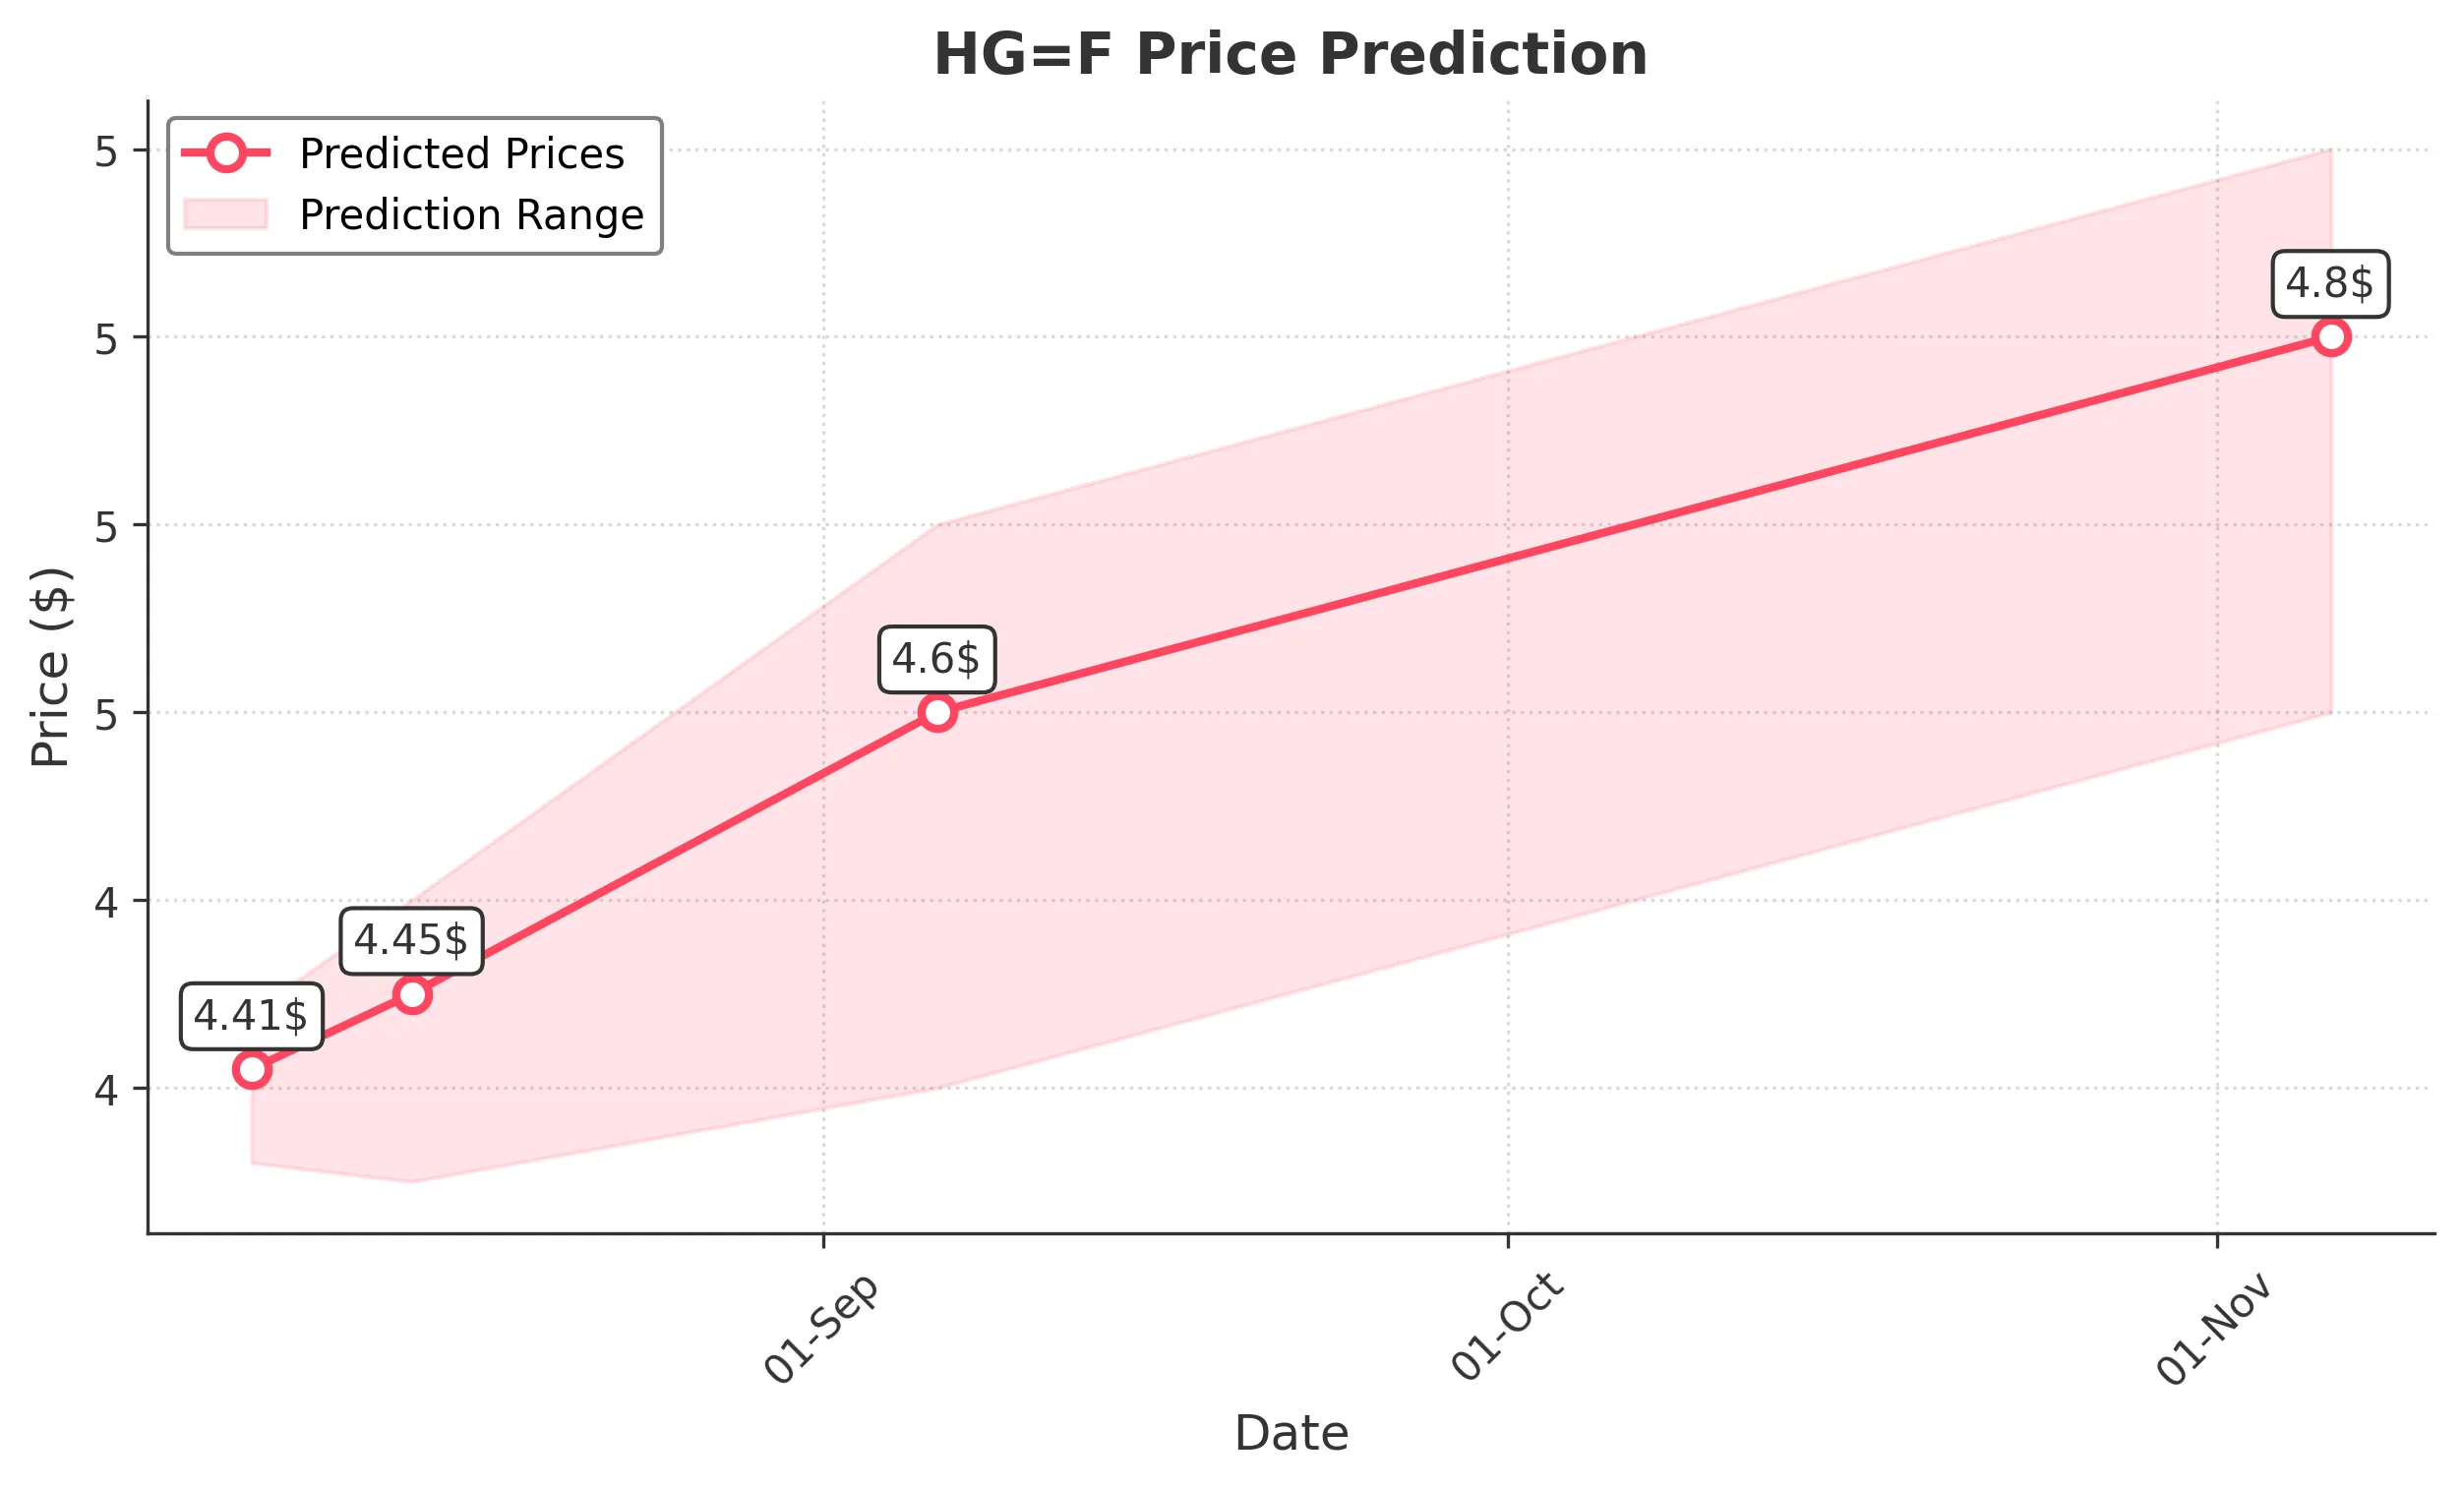
Target: August 7, 2025$4.41
$4.4
$4.44
$4.36
Description
The stock shows a slight bullish trend with a potential close around 4.4100. The RSI is near neutral, and the MACD indicates a possible upward momentum. However, recent volatility suggests caution.
Analysis
Over the past 3 months, HG=F has shown a bearish trend recently, with significant support around 4.30. The RSI indicates potential oversold conditions, while the MACD is close to crossing bullish. Volume has been inconsistent, indicating uncertainty.
Confidence Level
Potential Risks
Market sentiment is mixed, and external factors could lead to sudden price changes.
1 Week Prediction
Target: August 14, 2025$4.45
$4.42
$4.5
$4.35
Description
A slight recovery is expected as the stock approaches resistance at 4.50. The Bollinger Bands suggest a potential breakout, but caution is advised due to recent bearish pressure.
Analysis
The stock has been in a bearish phase, with resistance at 4.50. The ATR indicates increased volatility, and recent candlestick patterns show indecision. Volume spikes suggest traders are reacting to news, impacting price stability.
Confidence Level
Potential Risks
Potential for further declines if market sentiment shifts negatively.
1 Month Prediction
Target: September 6, 2025$4.6
$4.45
$4.7
$4.4
Description
A gradual recovery is anticipated as the stock tests higher resistance levels. The MACD shows signs of bullish divergence, indicating potential upward momentum.
Analysis
The stock has shown signs of recovery with key support at 4.30. The RSI is improving, and the MACD indicates bullish momentum. Volume trends suggest increased interest, but external market conditions remain a risk.
Confidence Level
Potential Risks
Economic factors or unexpected news could derail this recovery.
3 Months Prediction
Target: November 6, 2025$4.8
$4.7
$4.9
$4.6
Description
Long-term bullish sentiment is expected as the stock stabilizes above 4.70. The Fibonacci retracement levels suggest a target near 4.80, supported by improving fundamentals.
Analysis
The stock has been recovering from recent lows, with key resistance at 4.80. The MACD and RSI indicate bullish trends, while volume patterns suggest growing investor interest. However, external economic factors could pose risks.
Confidence Level
Potential Risks
Market volatility and macroeconomic changes could impact this outlook.