HGF Trading Predictions
1 Day Prediction
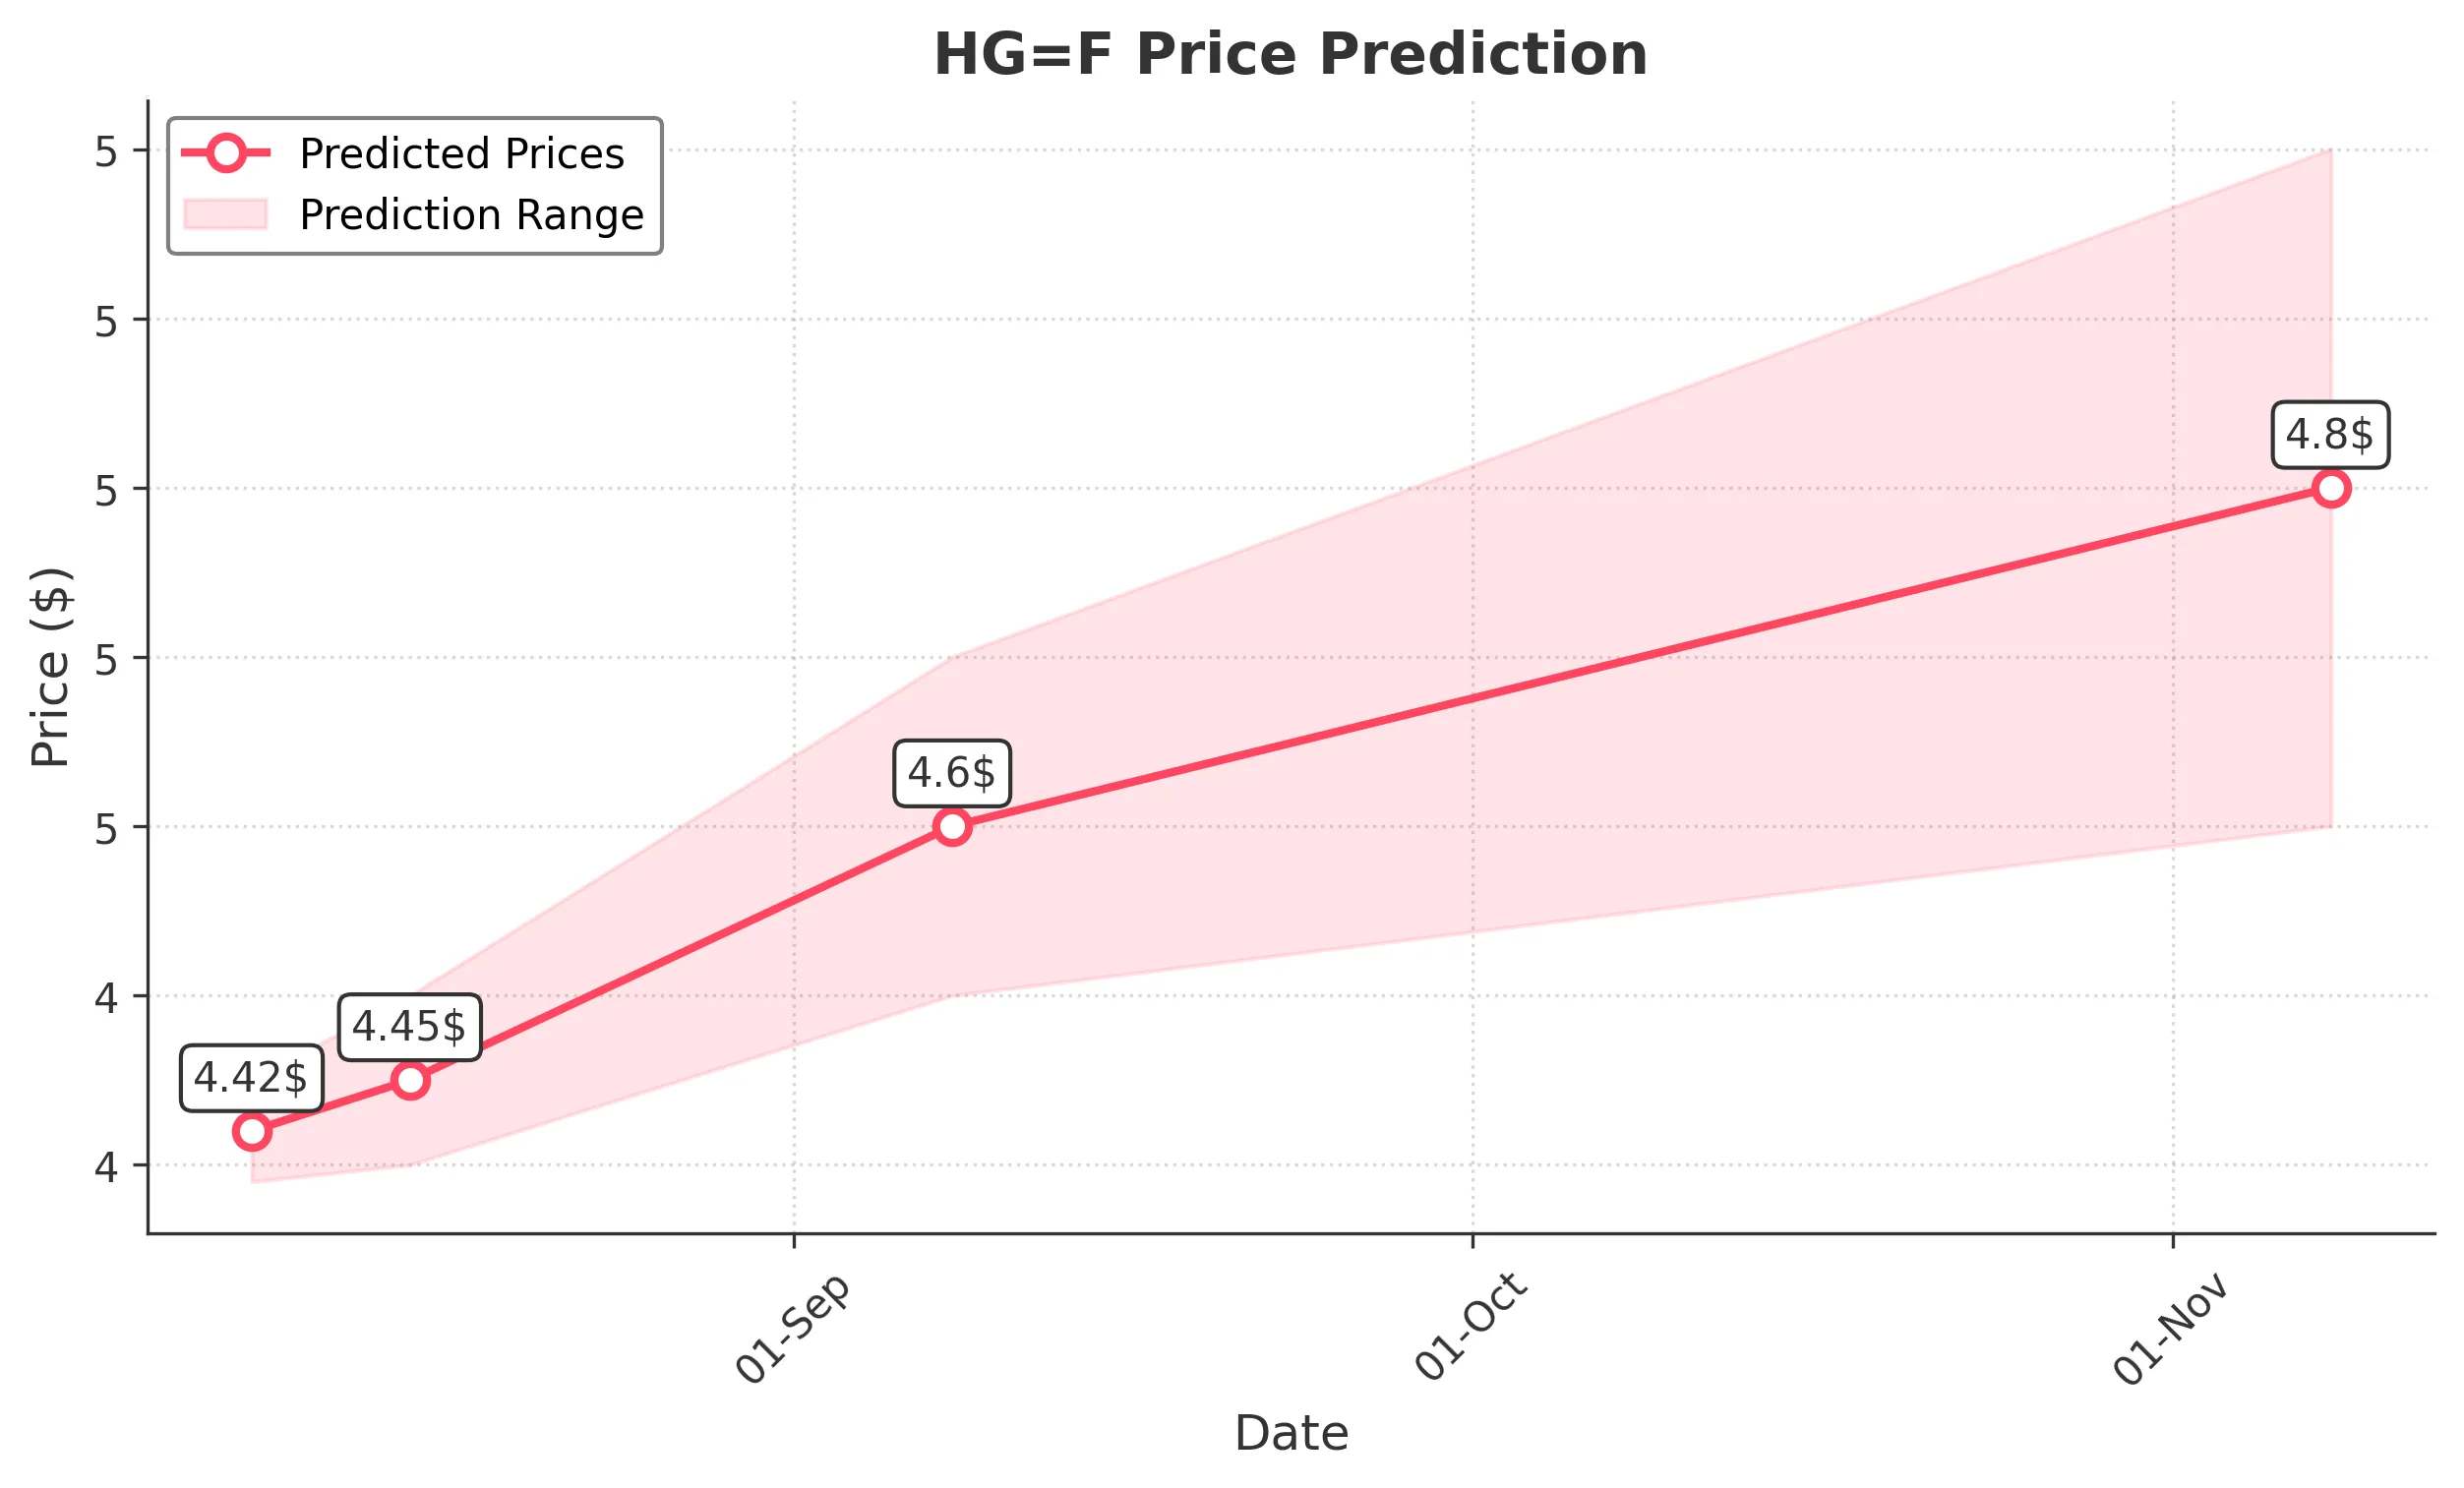
Target: August 8, 2025$4.42
$4.415
$4.45
$4.39
Description
The stock shows a slight bullish trend with a recent Doji candlestick indicating indecision. RSI is neutral, and MACD is close to crossing above the signal line, suggesting potential upward momentum. However, recent volatility may limit gains.
Analysis
Over the past 3 months, HG=F has shown a bearish trend with significant fluctuations. Key support is around 4.30, while resistance is near 5.00. The RSI indicates neutral conditions, and volume spikes suggest increased interest. Overall, the market sentiment remains cautious.
Confidence Level
Potential Risks
Market sentiment could shift due to external factors, and the recent high volatility may lead to unexpected price movements.
1 Week Prediction
Target: August 15, 2025$4.45
$4.42
$4.5
$4.4
Description
The stock may experience a slight recovery as it approaches a Fibonacci retracement level. The MACD shows potential bullish divergence, and the RSI is improving. However, the overall market sentiment remains cautious, which could cap gains.
Analysis
The stock has been in a bearish phase, with significant resistance at 5.00. Recent candlestick patterns indicate indecision, and volume analysis shows fluctuations. The ATR suggests increased volatility, and external economic factors could influence price movements.
Confidence Level
Potential Risks
Potential market corrections or negative news could reverse the upward trend, impacting the prediction's accuracy.
1 Month Prediction
Target: September 8, 2025$4.6
$4.45
$4.7
$4.5
Description
A potential bullish reversal is indicated as the stock approaches key support levels. The RSI is expected to rise, and MACD may confirm a bullish crossover. However, market volatility remains a concern, which could affect upward momentum.
Analysis
The stock has shown a bearish trend with significant resistance at 5.00. Recent volume patterns indicate increased trading activity, and the ATR suggests potential volatility. The market sentiment is mixed, with external factors likely influencing future performance.
Confidence Level
Potential Risks
Unforeseen macroeconomic events or shifts in market sentiment could lead to price declines, impacting the prediction's reliability.
3 Months Prediction
Target: November 8, 2025$4.8
$4.65
$5
$4.6
Description
The stock may recover towards the 5.00 resistance level as bullish patterns emerge. The MACD is expected to show a bullish trend, and RSI may indicate overbought conditions. However, external economic factors could introduce volatility.
Analysis
The stock has been in a bearish trend, with key support at 4.30 and resistance at 5.00. Recent candlestick patterns show indecision, and volume analysis indicates fluctuations. The market sentiment is cautious, with potential external influences impacting future performance.
Confidence Level
Potential Risks
Market conditions are unpredictable, and any negative news could lead to significant price corrections, affecting the accuracy of this prediction.