HGF Trading Predictions
1 Day Prediction
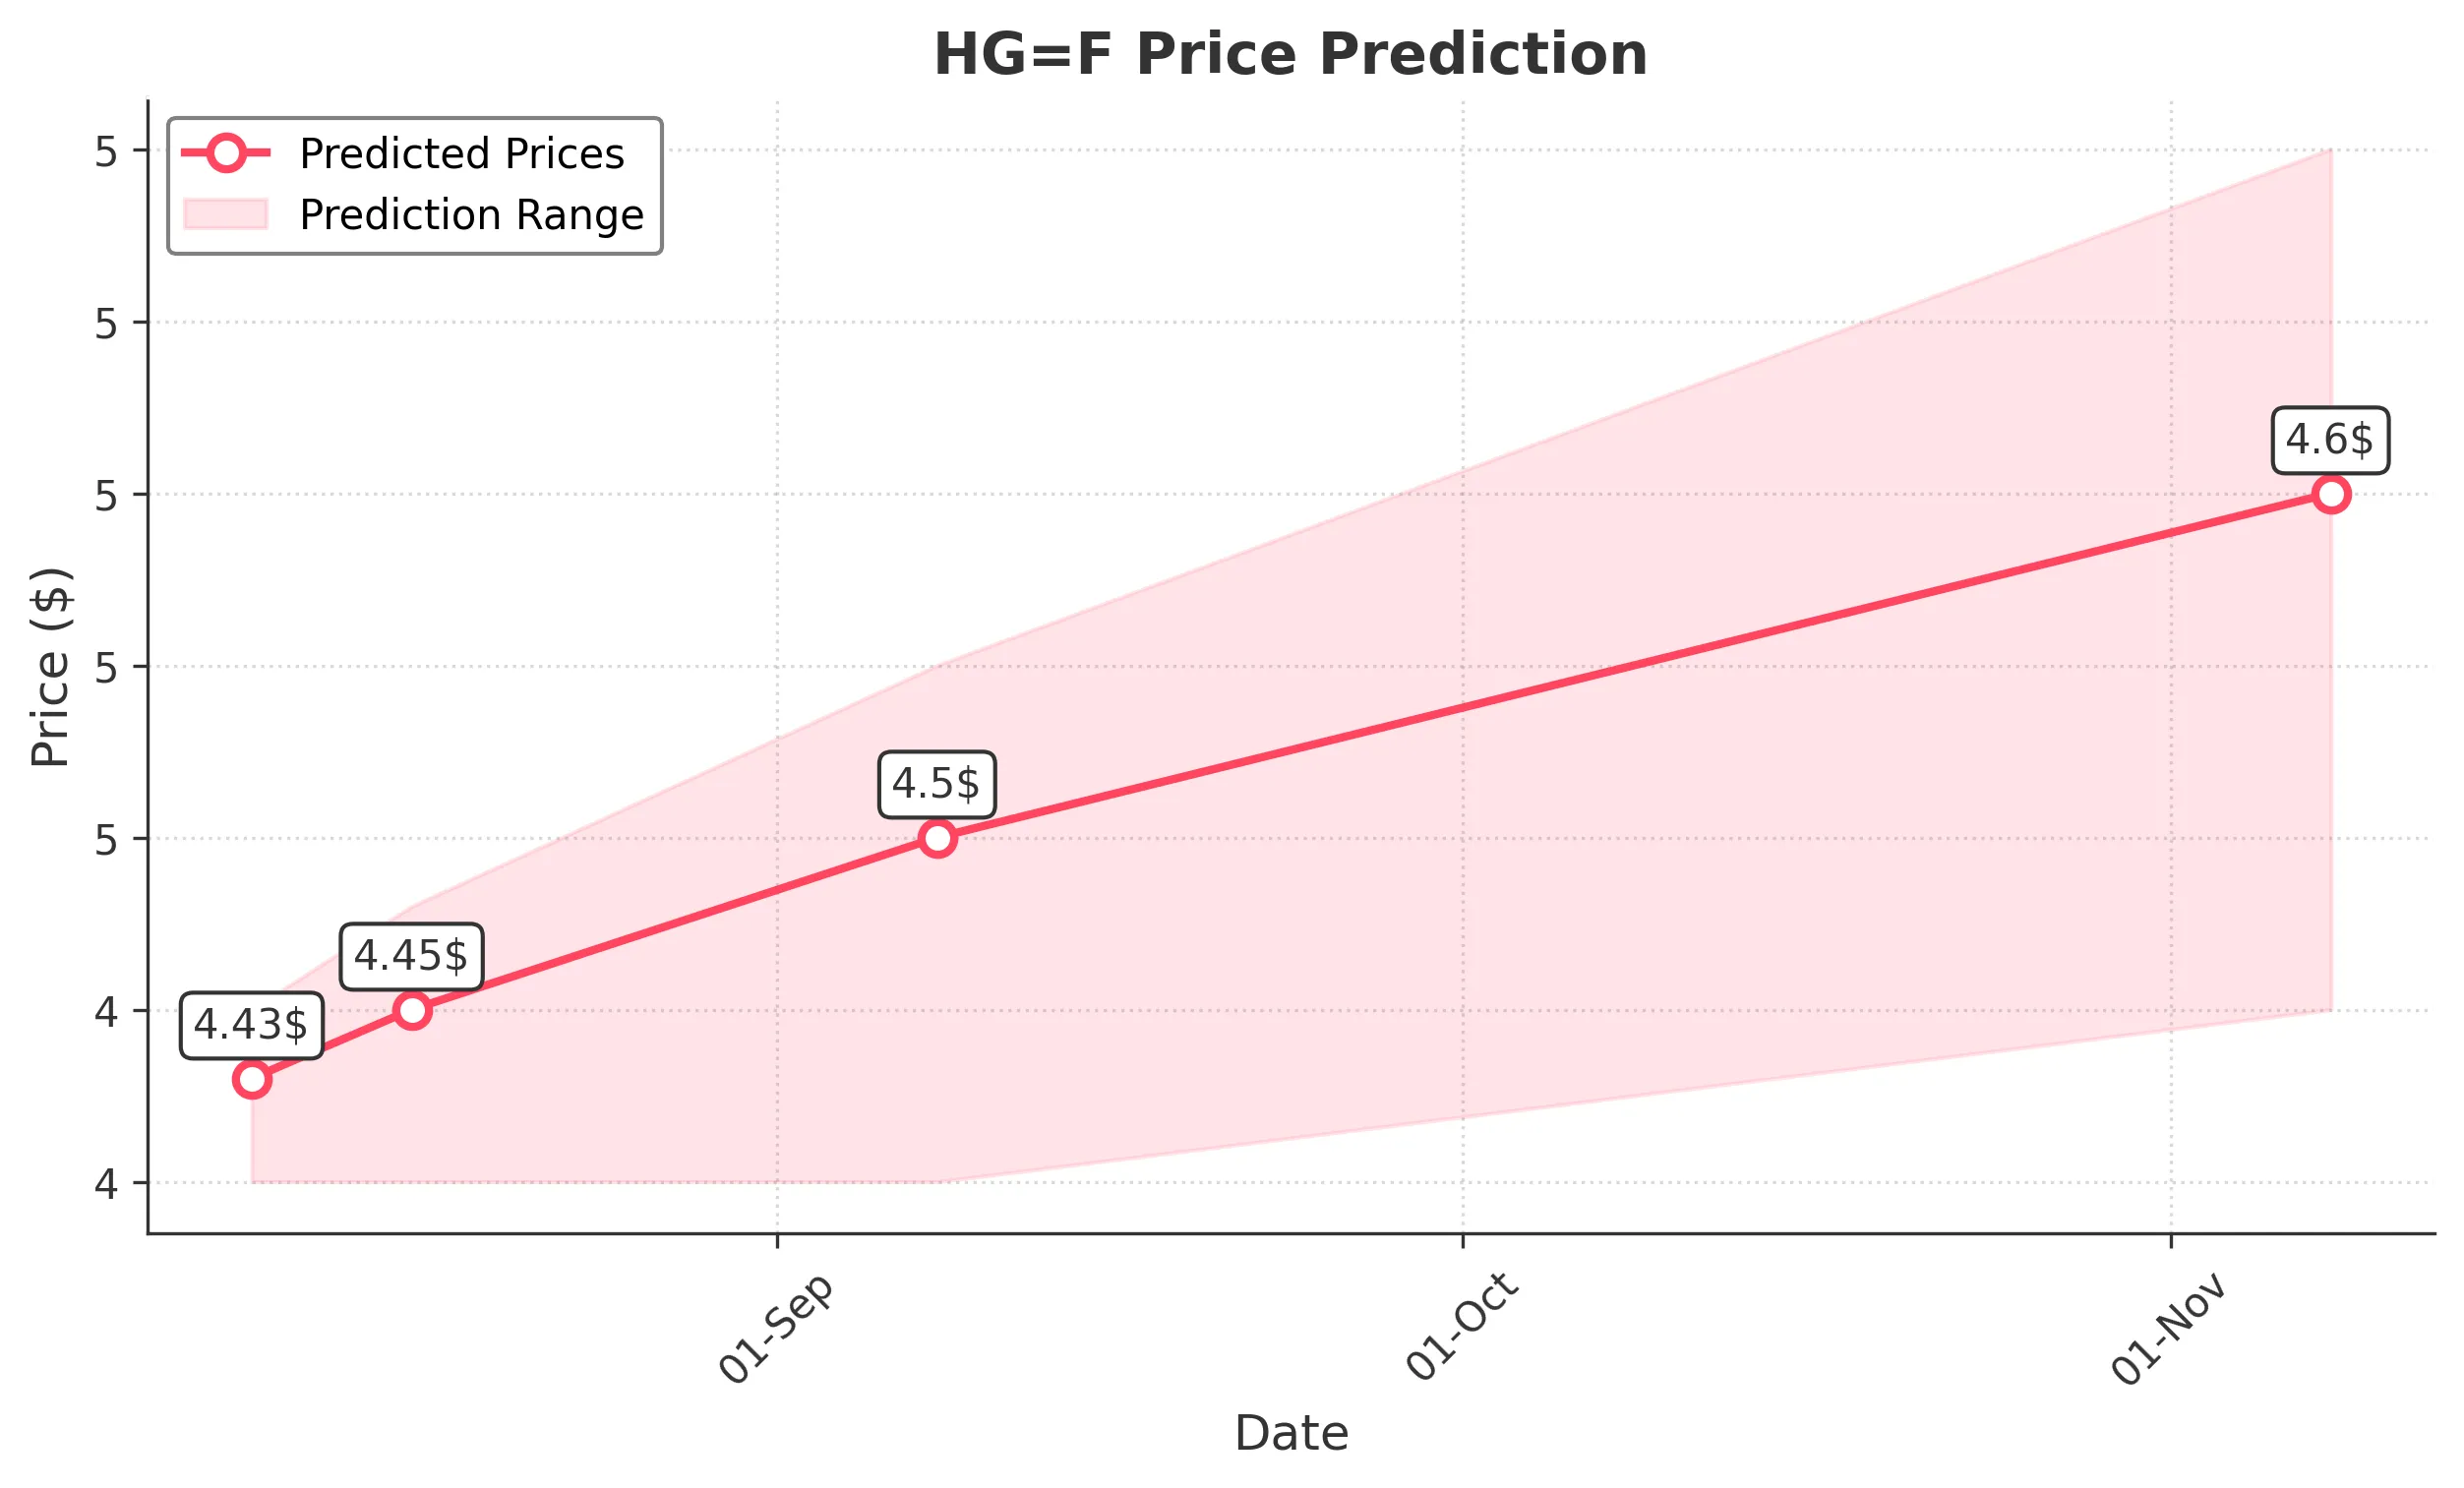
Target: August 9, 2025$4.43
$4.425
$4.45
$4.4
Description
The stock shows a slight bullish trend with a recent Doji pattern indicating indecision. RSI is neutral, and MACD is close to crossing above the signal line, suggesting potential upward movement. However, recent volatility may limit gains.
Analysis
Over the past 3 months, HG=F has shown a bearish trend recently, with significant support around 4.30. The stock has experienced high volatility, especially with recent price swings. Technical indicators like RSI and MACD suggest a potential reversal, but caution is warranted.
Confidence Level
Potential Risks
Market sentiment could shift quickly due to external factors, and the recent high volatility may lead to unexpected price movements.
1 Week Prediction
Target: August 16, 2025$4.45
$4.44
$4.48
$4.4
Description
The stock is expected to stabilize with a slight upward trend. The recent candlestick patterns indicate potential bullish momentum, but resistance at 4.50 may limit gains. Volume is expected to increase as traders react to market conditions.
Analysis
The stock has been fluctuating, with a recent bearish trend. Key support at 4.30 has held, but the overall market sentiment remains cautious. Technical indicators show mixed signals, indicating potential for both upward and downward movements.
Confidence Level
Potential Risks
Resistance levels may hold back price increases, and any negative news could lead to a quick reversal.
1 Month Prediction
Target: September 8, 2025$4.5
$4.48
$4.55
$4.4
Description
A gradual recovery is anticipated as the stock approaches key Fibonacci retracement levels. The RSI is expected to trend upwards, indicating increasing buying pressure. However, macroeconomic factors could impact overall market performance.
Analysis
The stock has shown signs of recovery after a bearish phase, with key support levels holding. Technical indicators suggest a potential upward trend, but external factors could influence market sentiment significantly.
Confidence Level
Potential Risks
Economic indicators and geopolitical events could introduce volatility, affecting the stock's recovery trajectory.
3 Months Prediction
Target: November 8, 2025$4.6
$4.58
$4.7
$4.45
Description
Long-term outlook remains cautiously optimistic as the stock may break through resistance levels. Continued bullish momentum is expected if market conditions remain stable. However, any economic downturn could reverse this trend.
Analysis
The stock has been in a volatile phase, with recent bearish trends. However, if it can maintain above key support levels, there is potential for recovery. Technical indicators suggest a cautious bullish outlook, but external factors must be monitored.
Confidence Level
Potential Risks
Potential economic downturns or changes in market sentiment could lead to unexpected price declines.