HGF Trading Predictions
1 Day Prediction
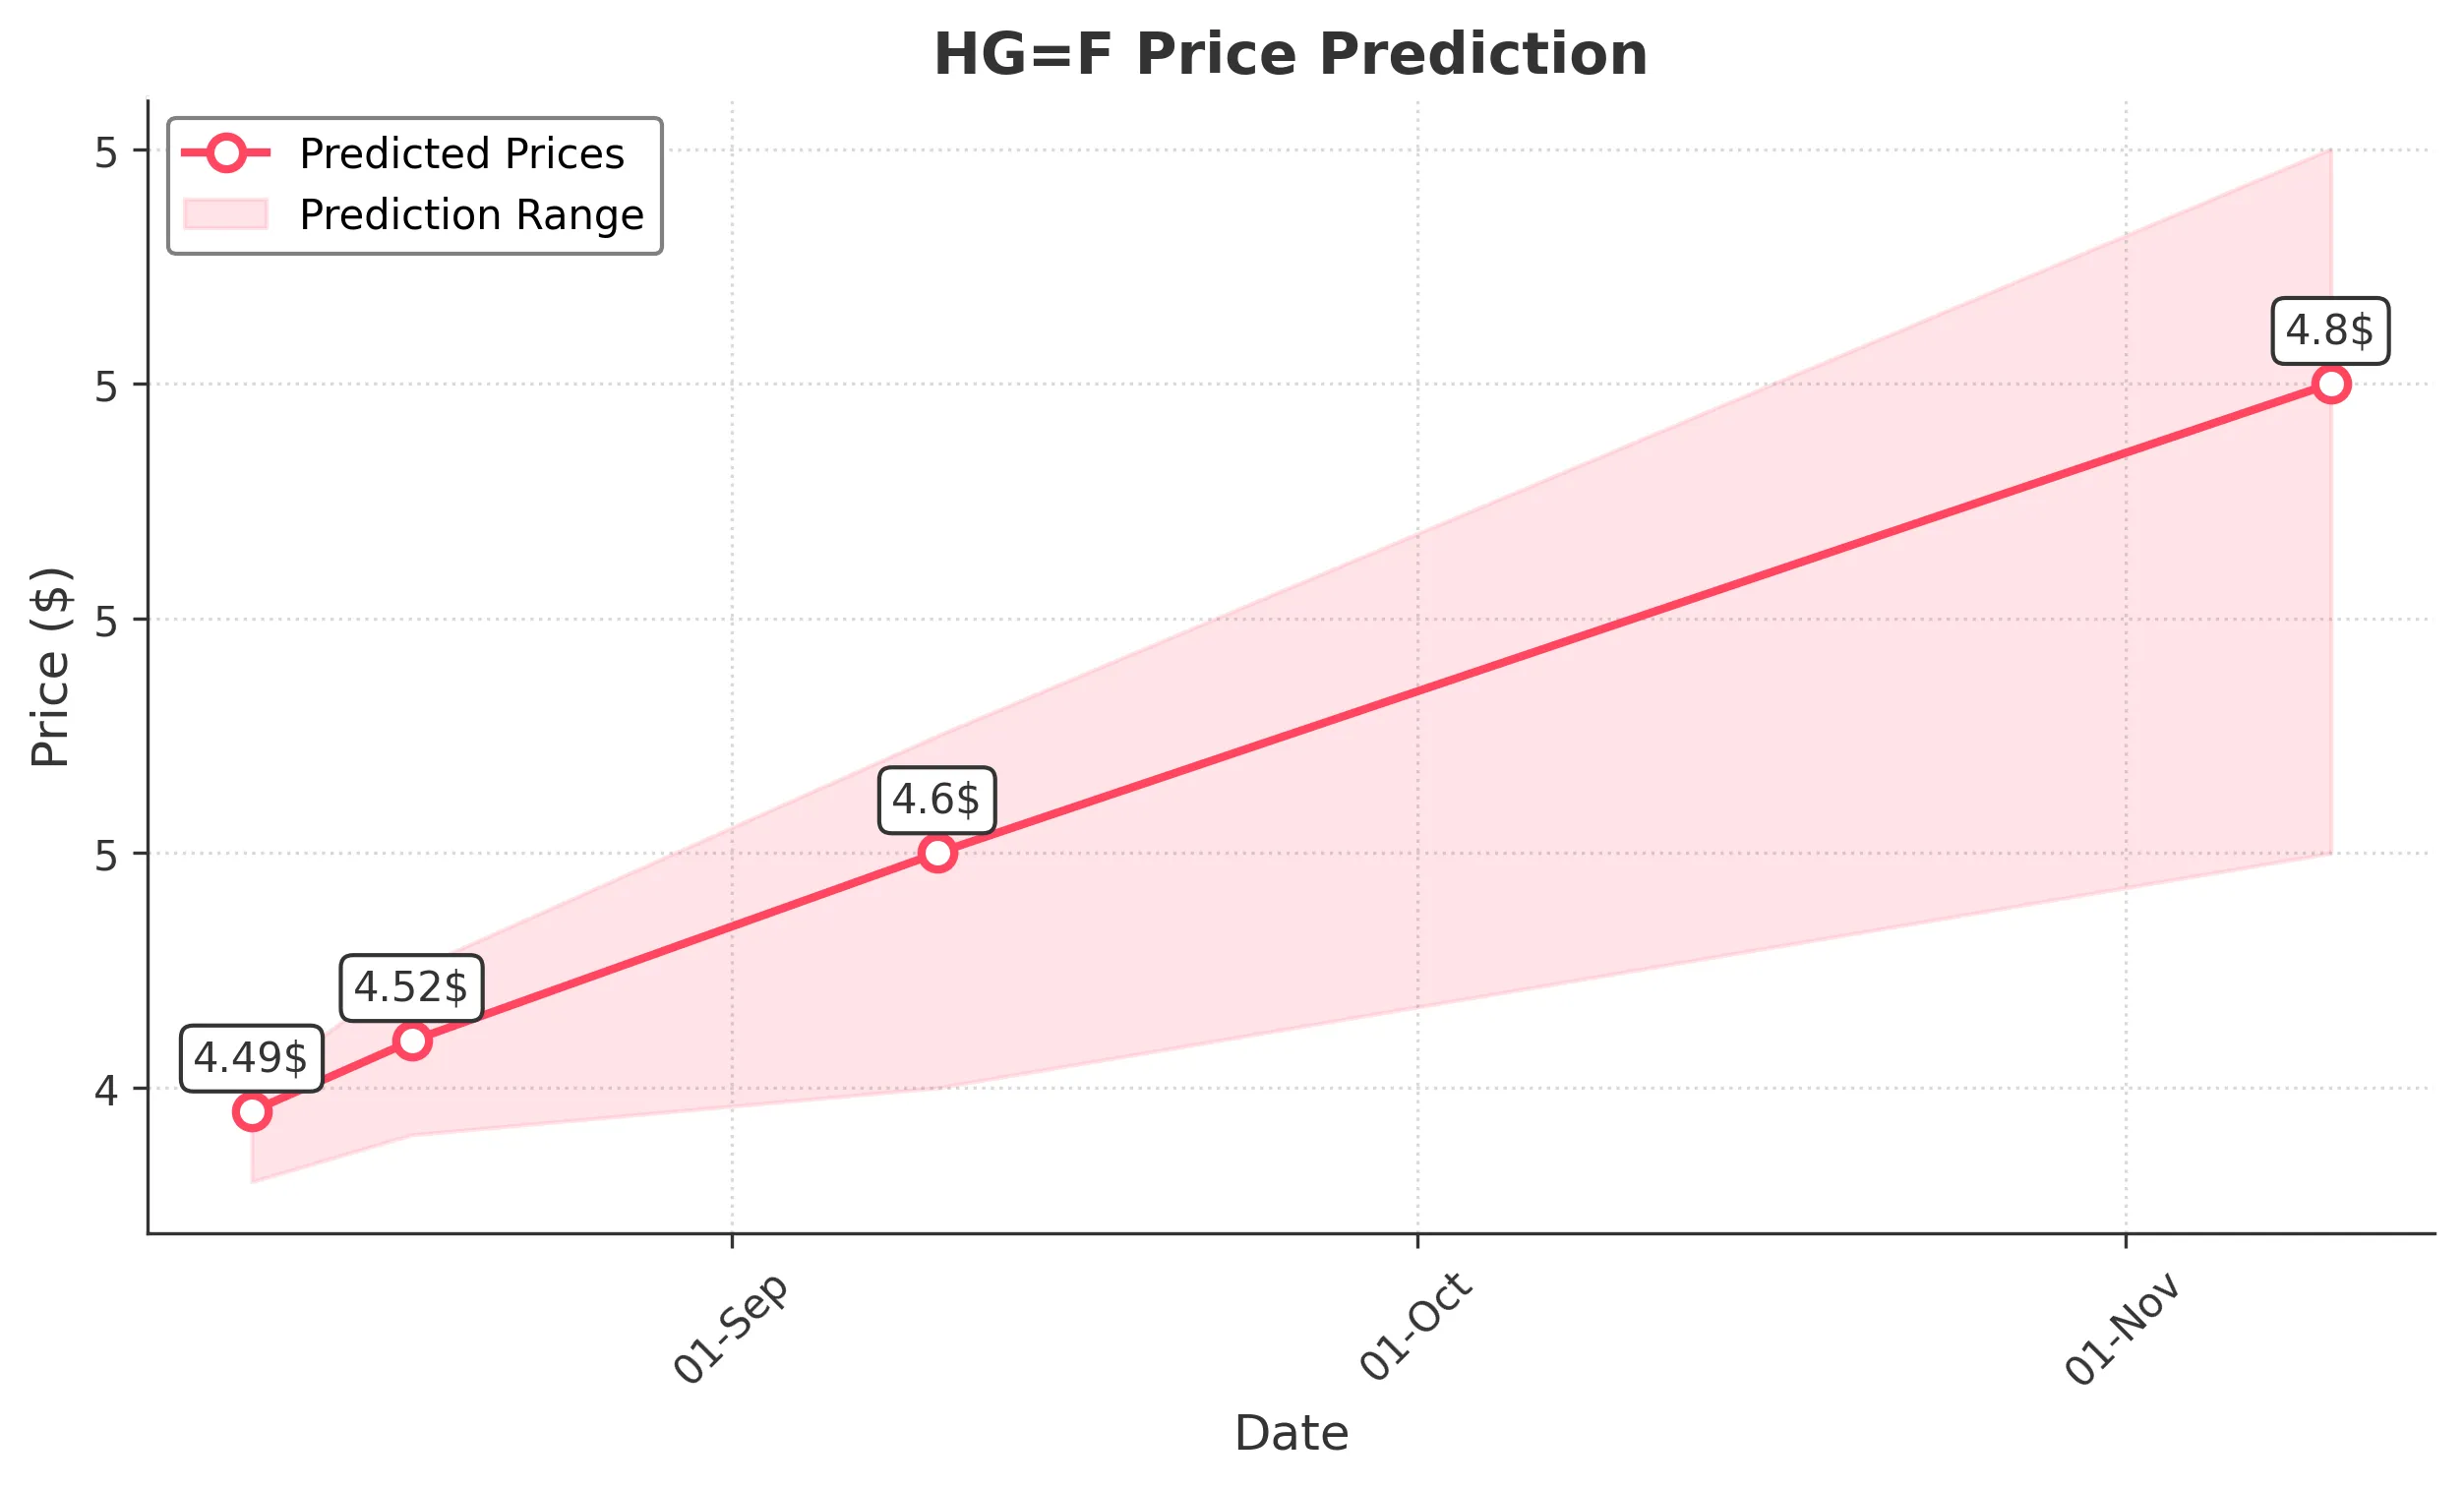
Target: August 11, 2025$4.49
$4.48
$4.5
$4.46
Description
The stock shows a slight bullish trend with a recent Doji candlestick indicating indecision. RSI is neutral, and MACD is close to crossing above the signal line, suggesting potential upward momentum. However, recent volatility may limit gains.
Analysis
Over the past 3 months, HG=F has shown a bullish trend with significant resistance around 5.00. The recent pullback indicates a potential consolidation phase. Key support is at 4.30. Volume has been inconsistent, with spikes indicating interest at certain price levels.
Confidence Level
Potential Risks
Market sentiment could shift due to external factors, and the recent high volatility may lead to unexpected price movements.
1 Week Prediction
Target: August 18, 2025$4.52
$4.49
$4.55
$4.48
Description
The stock is expected to recover slightly as bullish momentum builds. The MACD shows a potential bullish crossover, and the RSI is moving towards the overbought territory. However, resistance at 4.55 may limit upward movement.
Analysis
The stock has been in a sideways trend recently, with key support at 4.30 and resistance at 5.00. Technical indicators suggest a possible upward move, but the overall market sentiment remains cautious due to macroeconomic uncertainties.
Confidence Level
Potential Risks
Potential market corrections or negative news could impact the stock's performance, leading to a reversal.
1 Month Prediction
Target: September 10, 2025$4.6
$4.52
$4.65
$4.5
Description
A gradual increase is anticipated as the stock stabilizes. The Bollinger Bands indicate potential upward movement, and the RSI is expected to remain in a healthy range. However, resistance at 4.65 could pose challenges.
Analysis
The stock has shown resilience with a bullish trend over the past months. Key support at 4.30 remains intact, while resistance at 5.00 is a significant barrier. Volume patterns suggest increased interest, but caution is warranted due to potential market shifts.
Confidence Level
Potential Risks
Market volatility and external economic factors could lead to unexpected price fluctuations.
3 Months Prediction
Target: November 10, 2025$4.8
$4.7
$4.9
$4.6
Description
Long-term bullish sentiment is expected as the stock approaches key Fibonacci retracement levels. The MACD indicates a strong bullish trend, but overbought conditions may lead to corrections.
Analysis
The stock has been on an upward trajectory, with significant support at 4.30 and resistance at 5.00. Technical indicators suggest a bullish outlook, but external factors could introduce volatility. Overall, the market sentiment is cautiously optimistic.
Confidence Level
Potential Risks
Macroeconomic events and market sentiment shifts could impact the stock's trajectory, leading to potential pullbacks.