HGF Trading Predictions
1 Day Prediction
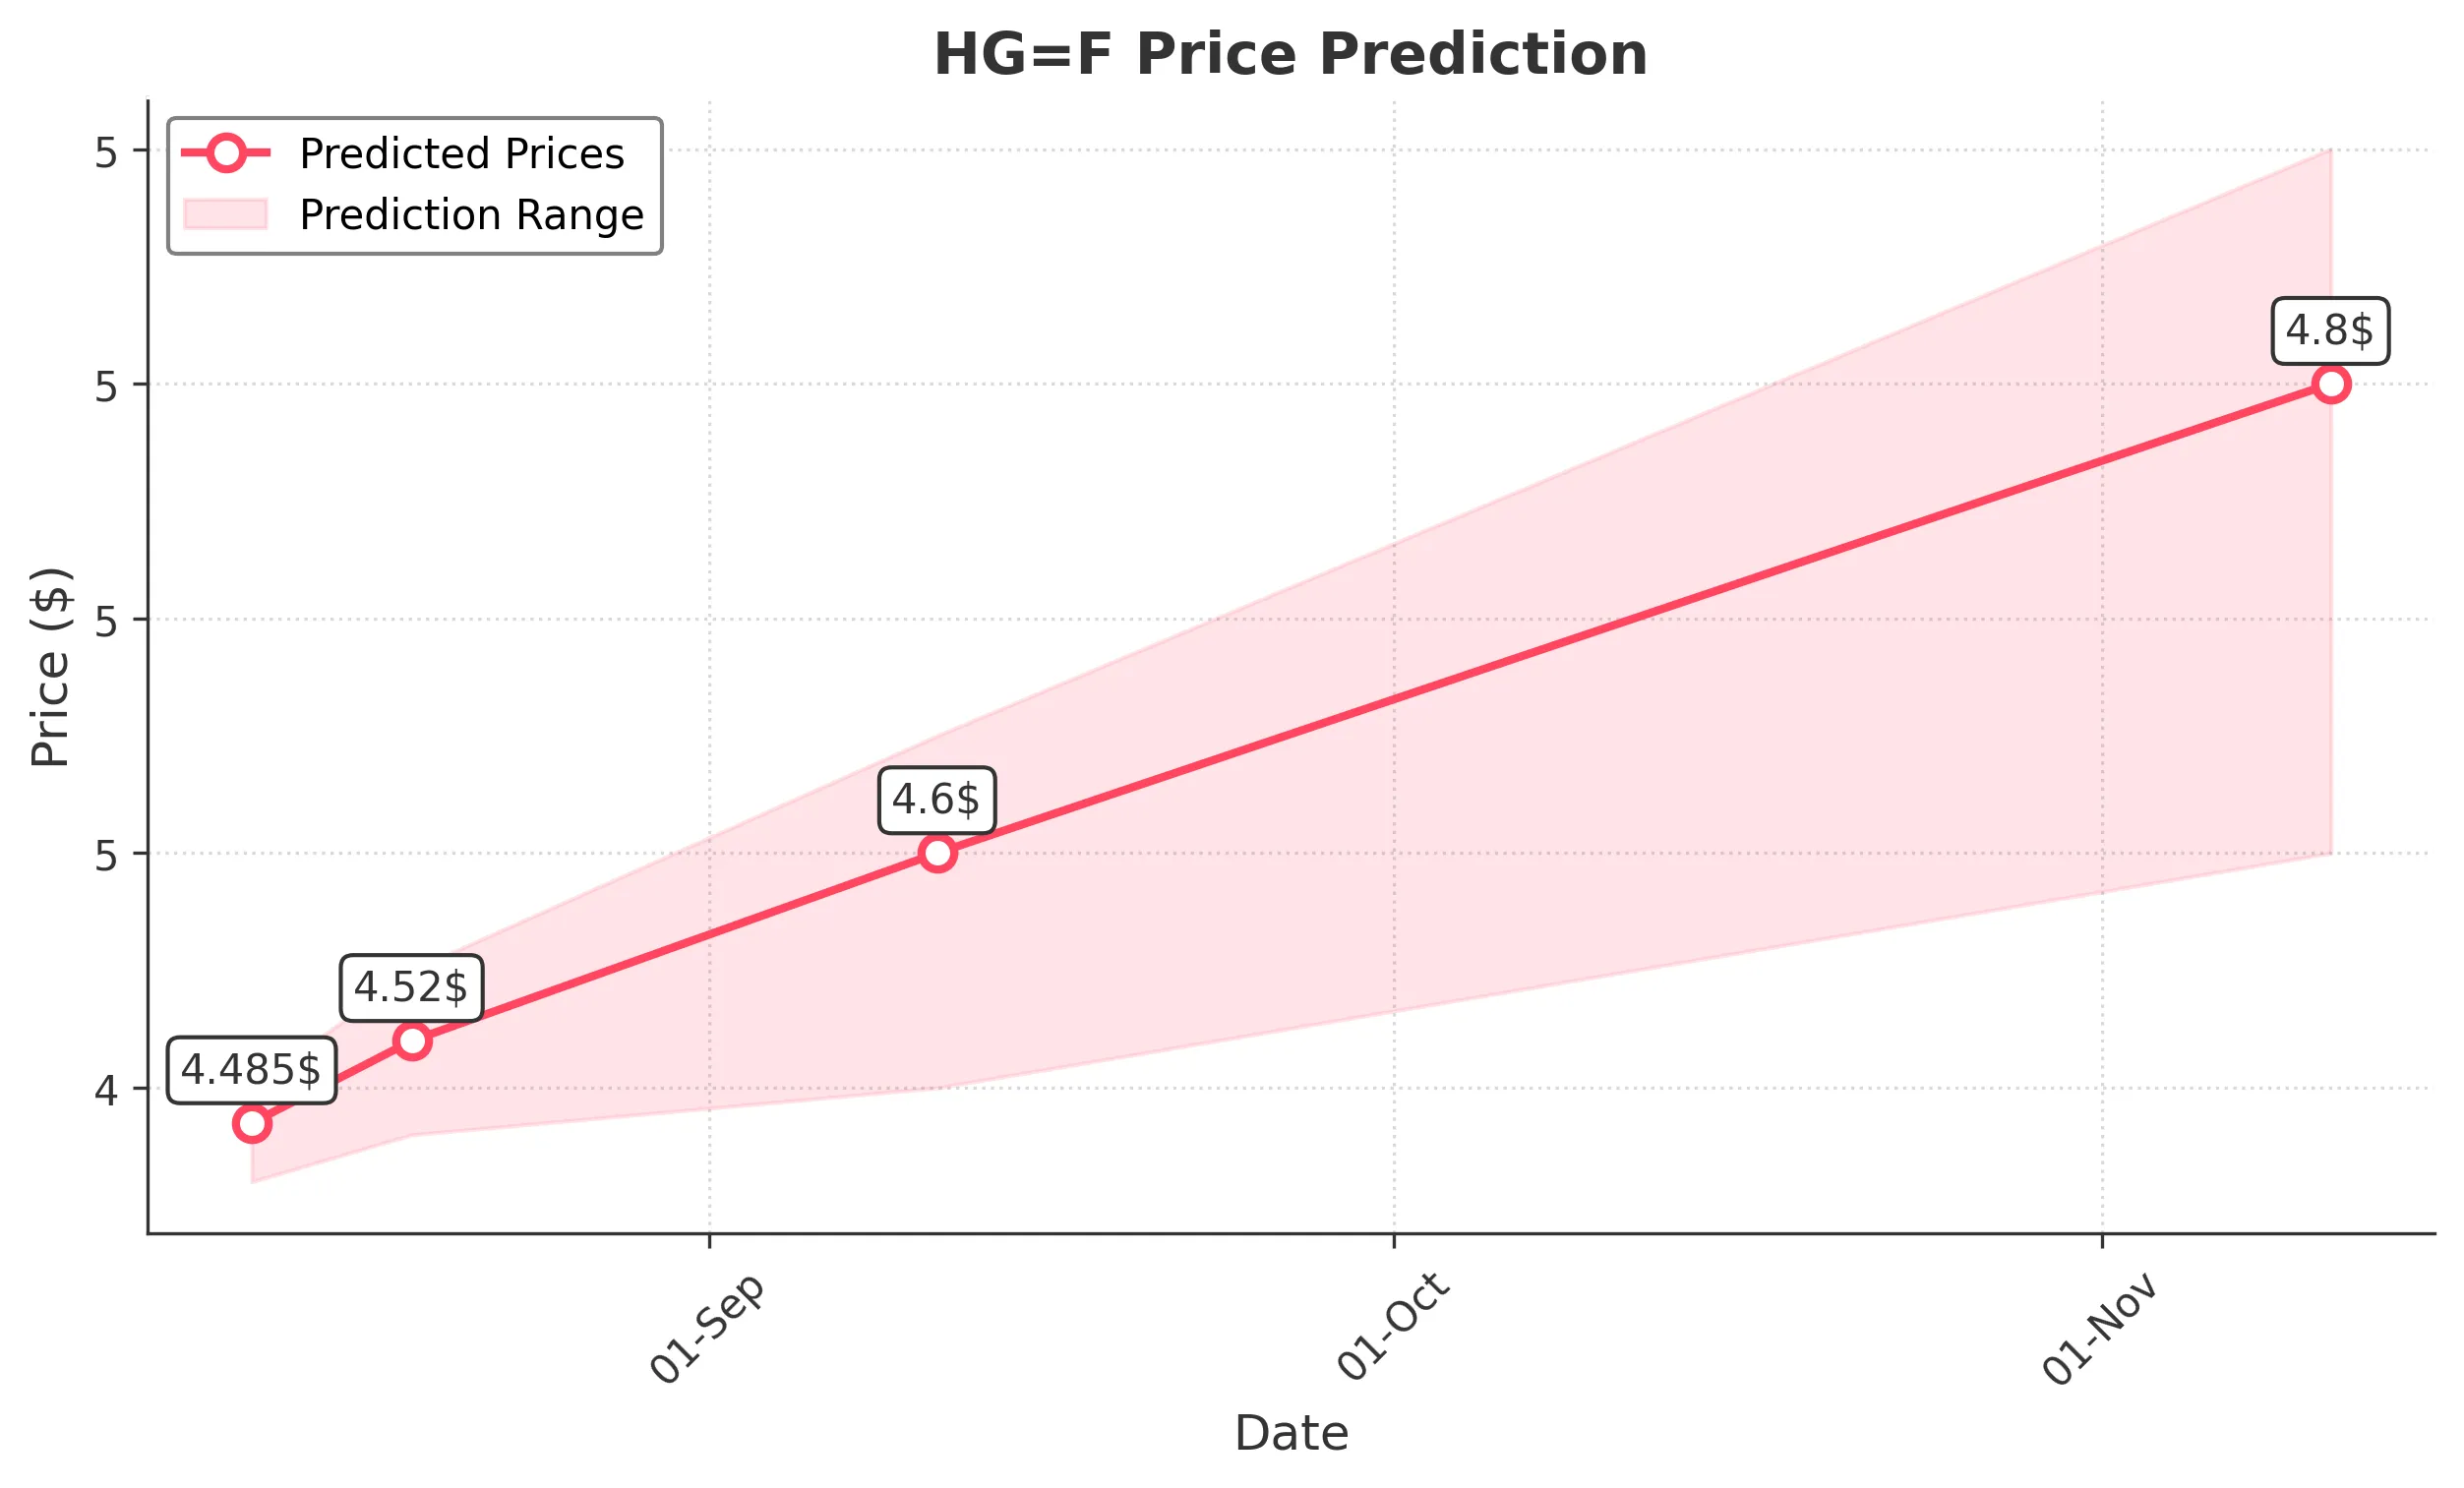
Target: August 12, 2025$4.485
$4.472
$4.5
$4.46
Description
The stock shows a slight bullish trend with a recent close at 4.4720. The RSI is neutral, and MACD indicates potential upward momentum. However, recent volatility suggests caution. Expect a close around 4.4850.
Analysis
Over the past 3 months, HG=F has shown a bearish trend recently, with significant support at 4.30 and resistance around 5.00. The RSI indicates neutral conditions, while MACD shows potential for upward movement. Volume has been inconsistent, indicating uncertainty.
Confidence Level
Potential Risks
Market sentiment could shift due to external factors, and recent volatility may lead to unexpected price movements.
1 Week Prediction
Target: August 19, 2025$4.52
$4.485
$4.55
$4.48
Description
With a slight upward trend and a recent close of 4.4720, the stock may see a gradual increase. The Bollinger Bands suggest potential for upward movement, but caution is advised due to recent volatility.
Analysis
The stock has been fluctuating, with a recent bearish trend. Key support is at 4.30, while resistance is around 5.00. The RSI is neutral, and MACD shows mixed signals. Volume patterns indicate uncertainty, suggesting a cautious approach.
Confidence Level
Potential Risks
Potential market corrections or external news could impact the stock's performance, leading to unexpected price changes.
1 Month Prediction
Target: September 11, 2025$4.6
$4.52
$4.65
$4.5
Description
The stock may recover slightly over the month, with a predicted close of 4.6000. The MACD shows potential bullish divergence, but the overall market sentiment remains cautious.
Analysis
The stock has shown bearish tendencies recently, with significant support at 4.30. The RSI is neutral, and MACD indicates potential upward movement. Volume has been inconsistent, reflecting market uncertainty.
Confidence Level
Potential Risks
Market volatility and external economic factors could lead to unexpected price movements, impacting the prediction's accuracy.
3 Months Prediction
Target: November 11, 2025$4.8
$4.6
$4.9
$4.6
Description
Over the next three months, the stock may trend upwards towards 4.8000, supported by potential bullish signals from MACD and RSI. However, external factors could influence market sentiment.
Analysis
The stock has been in a bearish trend recently, with key support at 4.30 and resistance around 5.00. The RSI is neutral, and MACD shows mixed signals. Volume patterns indicate uncertainty, suggesting a cautious outlook.
Confidence Level
Potential Risks
Unforeseen macroeconomic events or shifts in market sentiment could lead to significant price fluctuations, impacting the prediction's reliability.