HGF Trading Predictions
1 Day Prediction
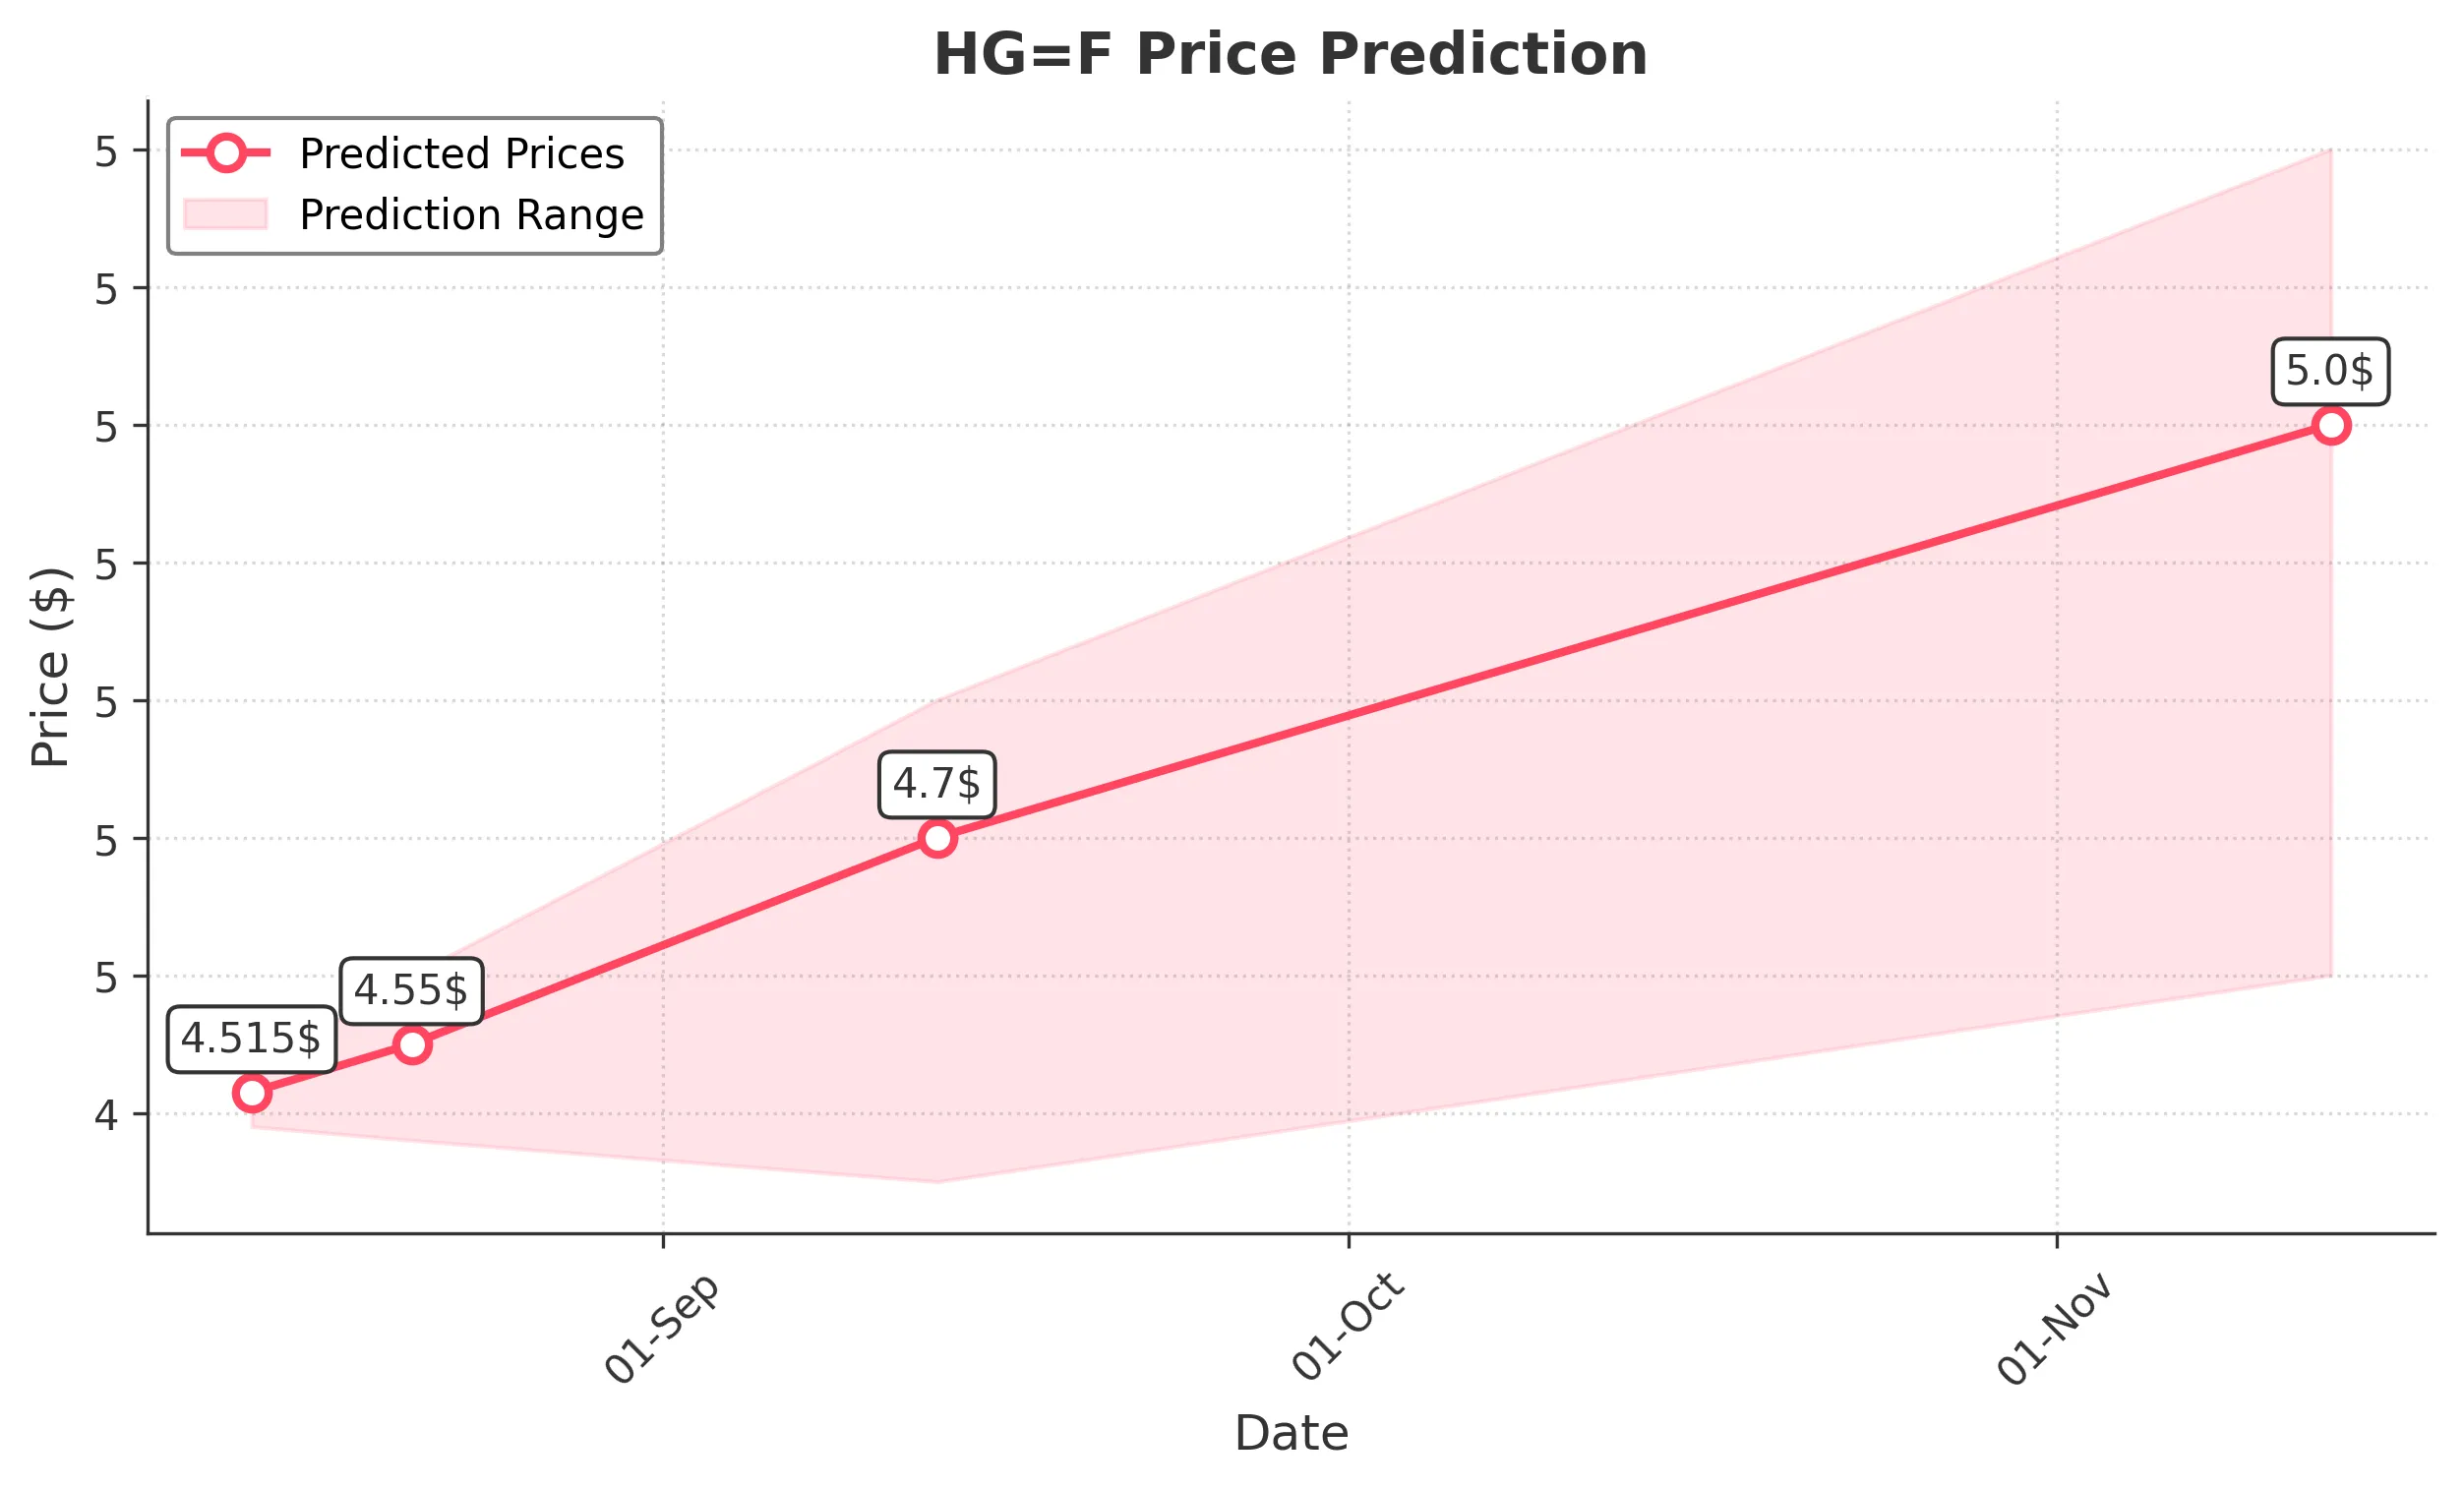
Target: August 14, 2025$4.515
$4.51
$4.53
$4.49
Description
The stock shows a slight bullish trend with a recent Doji candlestick indicating indecision. RSI is neutral, and MACD is close to crossing above the signal line, suggesting potential upward momentum. However, recent volatility may limit gains.
Analysis
Over the past 3 months, HG=F has shown a bearish trend recently, with significant support around 4.30. The stock has experienced high volatility, especially with recent price swings. Technical indicators suggest a potential reversal, but caution is warranted.
Confidence Level
Potential Risks
Market sentiment could shift quickly due to external news or economic data releases, which may impact the stock's performance.
1 Week Prediction
Target: August 21, 2025$4.55
$4.515
$4.6
$4.48
Description
The stock may see a slight recovery as it approaches a Fibonacci retracement level. The recent bullish engulfing pattern suggests a potential reversal. However, the overall bearish sentiment in the market could limit upside potential.
Analysis
The stock has been in a bearish phase, with resistance around 4.60. Volume has been inconsistent, indicating uncertainty among investors. Technical indicators show mixed signals, with some suggesting a potential bounce while others indicate continued weakness.
Confidence Level
Potential Risks
Unforeseen macroeconomic events or changes in market sentiment could lead to a downward trend despite the current indicators.
1 Month Prediction
Target: September 13, 2025$4.7
$4.55
$4.8
$4.45
Description
A potential bullish trend may develop as the stock approaches key support levels. The RSI indicates oversold conditions, and a bullish divergence in MACD could signal a reversal. However, market volatility remains a concern.
Analysis
The stock has been fluctuating with a bearish bias, but recent patterns suggest a possible reversal. Key support at 4.30 remains critical, while resistance at 4.80 could cap gains. Overall, the market sentiment is cautious, reflecting broader economic uncertainties.
Confidence Level
Potential Risks
The stock's performance could be heavily influenced by broader market trends and economic indicators, which may lead to unexpected price movements.
3 Months Prediction
Target: November 13, 2025$5
$4.8
$5.2
$4.6
Description
If the bullish trend continues, the stock could reach 5.00, supported by a recovery in market sentiment and potential positive macroeconomic developments. However, resistance levels may pose challenges.
Analysis
The stock has shown significant volatility, with a recent bearish trend. Key resistance levels are around 5.20, while support is at 4.60. The overall market sentiment is mixed, and external factors could heavily influence future performance.
Confidence Level
Potential Risks
Long-term predictions are uncertain due to potential market corrections and economic shifts that could impact demand for the stock.