META Trading Predictions
1 Day Prediction
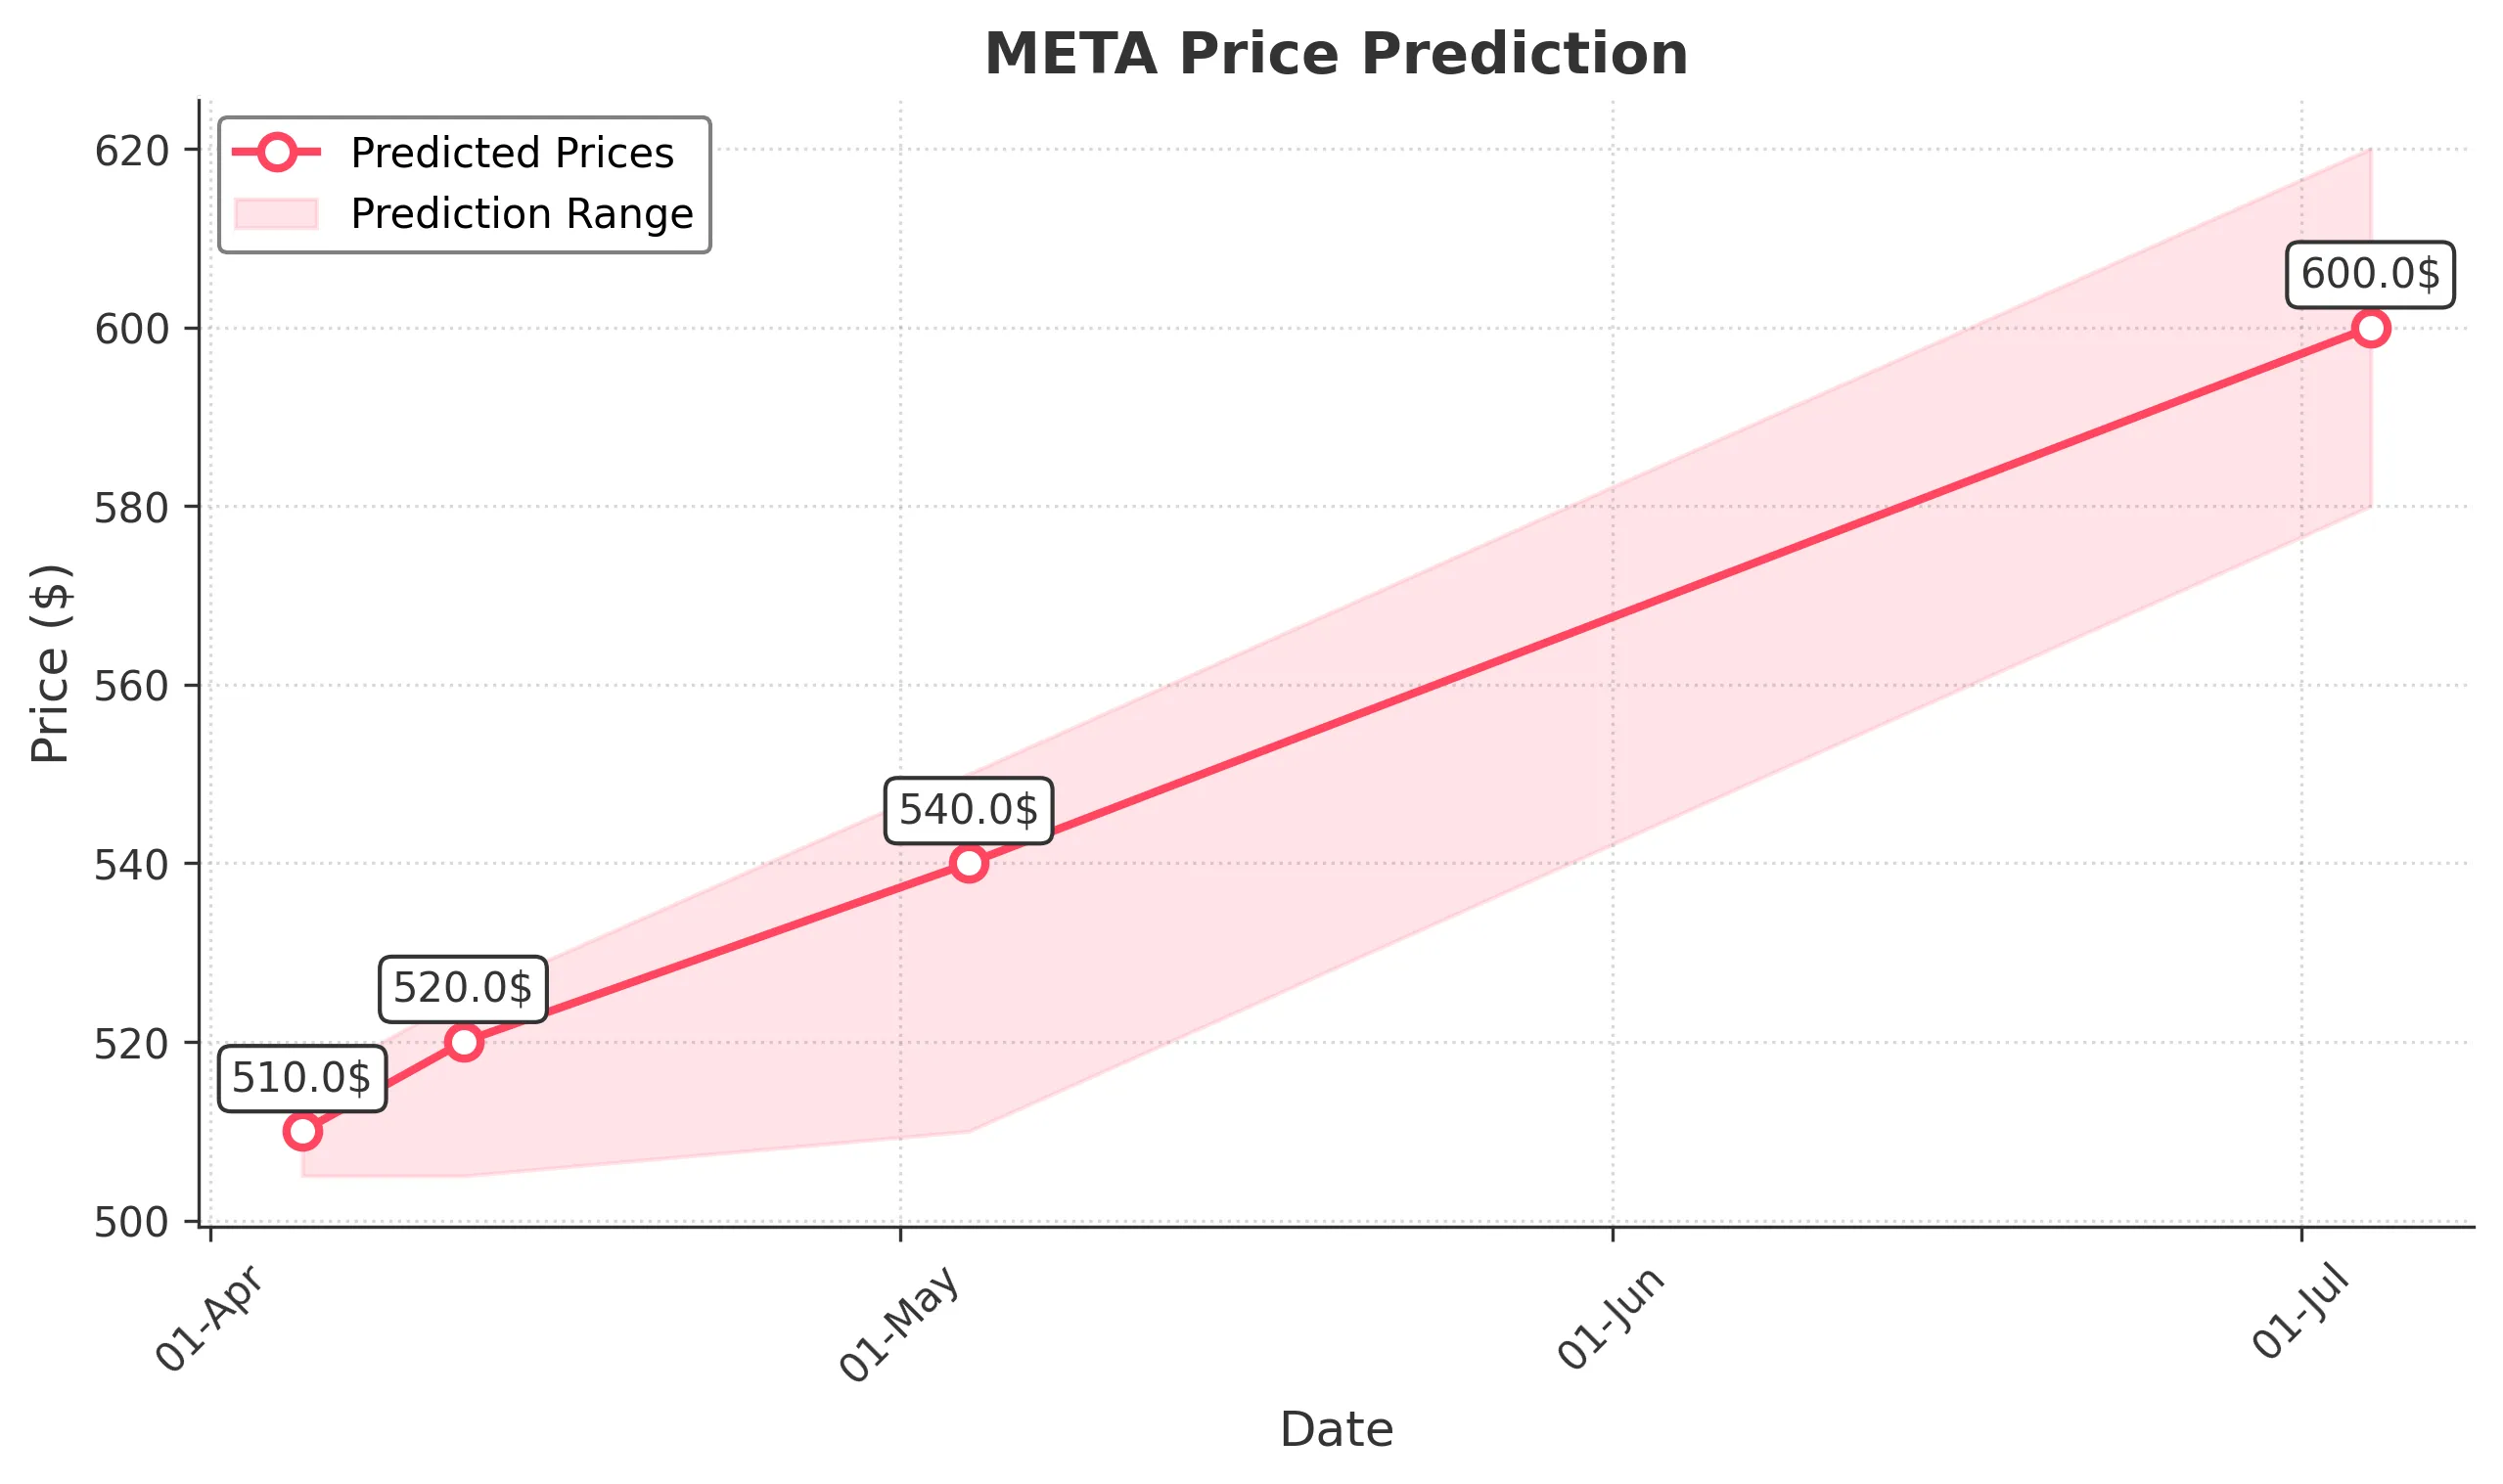
Target: April 5, 2025$510
$511
$515
$505
Description
The stock shows bearish momentum with a recent downtrend. The RSI indicates oversold conditions, but a potential bounce could occur. MACD is negative, suggesting continued weakness. Volume spikes on down days indicate selling pressure.
Analysis
Over the past 3 months, META has experienced significant volatility, with a bearish trend recently. Key support is around 500, while resistance is near 600. The MACD and RSI suggest bearish momentum, but potential for a short-term bounce exists.
Confidence Level
Potential Risks
Market sentiment is volatile, and any unexpected news could lead to further declines or a reversal.
1 Week Prediction
Target: April 12, 2025$520
$515
$525
$505
Description
A slight recovery is anticipated as the stock may find support at recent lows. The RSI may begin to recover, indicating potential buying interest. However, the overall trend remains bearish, and caution is advised.
Analysis
The stock has been in a downtrend, with significant resistance at 600. Recent volume spikes indicate selling pressure. The MACD remains negative, but a potential short-term recovery could occur if support holds.
Confidence Level
Potential Risks
Continued bearish sentiment and macroeconomic factors could hinder recovery, leading to further declines.
1 Month Prediction
Target: May 4, 2025$540
$530
$550
$510
Description
A gradual recovery is expected as the stock may stabilize after recent declines. The RSI could improve, indicating a potential reversal. However, the overall bearish trend remains a concern.
Analysis
META has shown significant volatility, with key support around 500. The stock's performance has been bearish, but potential for recovery exists if buying interest increases. The MACD and RSI suggest caution.
Confidence Level
Potential Risks
Market volatility and external economic factors could impact the recovery, leading to further uncertainty.
3 Months Prediction
Target: July 4, 2025$600
$590
$620
$580
Description
If the stock can stabilize and attract buying interest, a recovery towards 600 is possible. The RSI may indicate improved momentum, but the bearish trend remains a risk.
Analysis
The stock has been in a bearish trend, with significant resistance at 600. Recent volume patterns indicate selling pressure, but potential for recovery exists if market sentiment improves. Caution is advised.
Confidence Level
Potential Risks
Long-term bearish sentiment and macroeconomic conditions could hinder recovery, leading to potential declines.