META Trading Predictions
1 Day Prediction
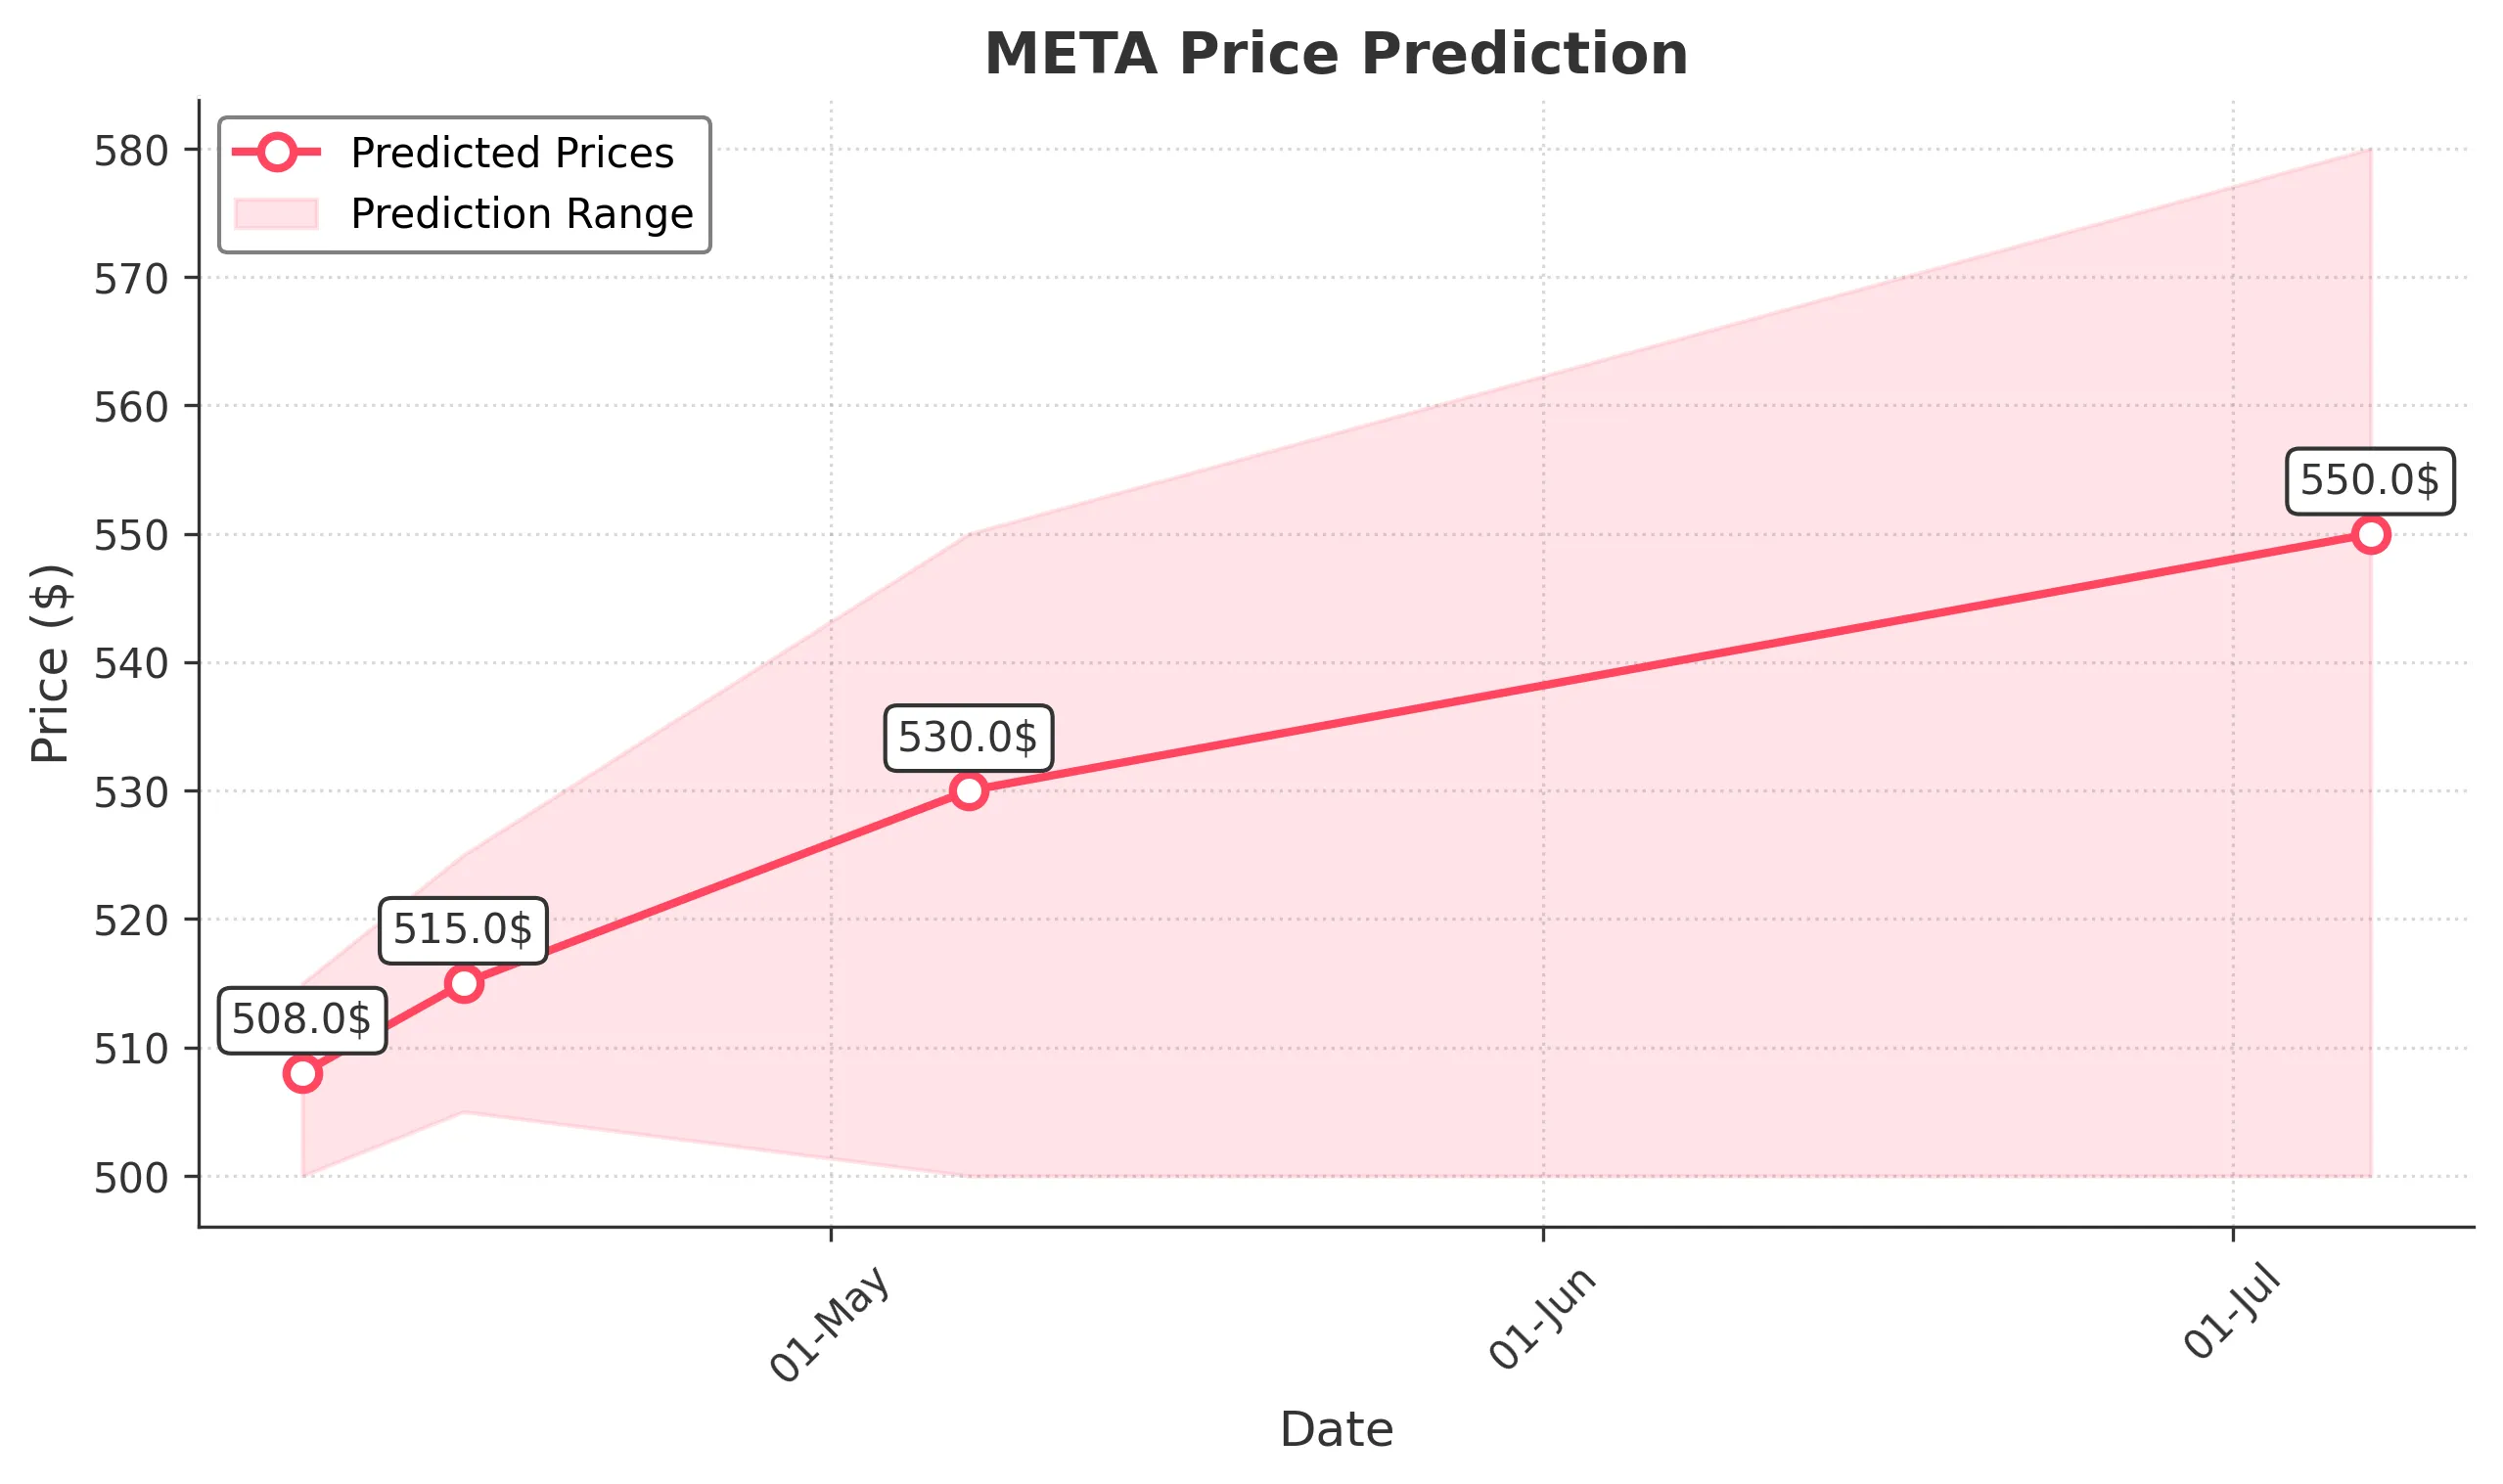
Target: April 8, 2025$508
$506
$515
$500
Description
The stock shows bearish momentum with a recent downtrend. The RSI indicates oversold conditions, but a potential bounce could occur. Volume spikes suggest increased selling pressure. Watch for support around 500.
Analysis
META has experienced a bearish trend over the past three months, with significant support at 500. Technical indicators like MACD are bearish, and the ATR indicates increased volatility. Volume patterns show spikes during sell-offs, suggesting caution.
Confidence Level
Potential Risks
Market volatility and external news could impact the prediction. A reversal is possible if bullish sentiment returns.
1 Week Prediction
Target: April 15, 2025$515
$510
$525
$505
Description
A slight recovery is anticipated as the stock may find support at 500. The RSI is approaching neutral, indicating potential for a rebound. However, bearish sentiment remains prevalent.
Analysis
The stock has shown a bearish trend, with resistance around 525. The MACD is still negative, but a potential reversal could occur if buying pressure increases. Volume analysis indicates a need for caution as selling persists.
Confidence Level
Potential Risks
Uncertainty in market conditions and potential negative news could hinder recovery efforts.
1 Month Prediction
Target: May 7, 2025$530
$520
$550
$500
Description
A gradual recovery is expected as the stock stabilizes around 500. The RSI may improve, indicating a potential bullish reversal. However, macroeconomic factors could still weigh heavily.
Analysis
META's performance has been bearish, with significant resistance at 550. The stock's volatility is high, and the ATR suggests potential for large price swings. Volume patterns indicate a struggle for buyers to gain control.
Confidence Level
Potential Risks
Market sentiment remains fragile, and any negative news could derail recovery efforts.
3 Months Prediction
Target: July 7, 2025$550
$540
$580
$500
Description
If the market stabilizes, a recovery towards 550 is plausible. The RSI may indicate a bullish trend, but external factors could still pose risks. Watch for macroeconomic developments.
Analysis
The stock has been in a bearish trend, with key support at 500. Technical indicators suggest a potential for recovery, but the overall market sentiment remains cautious. Volume analysis shows a struggle for upward momentum.
Confidence Level
Potential Risks
High uncertainty due to potential market volatility and economic conditions that could impact stock performance.