META Trading Predictions
1 Day Prediction
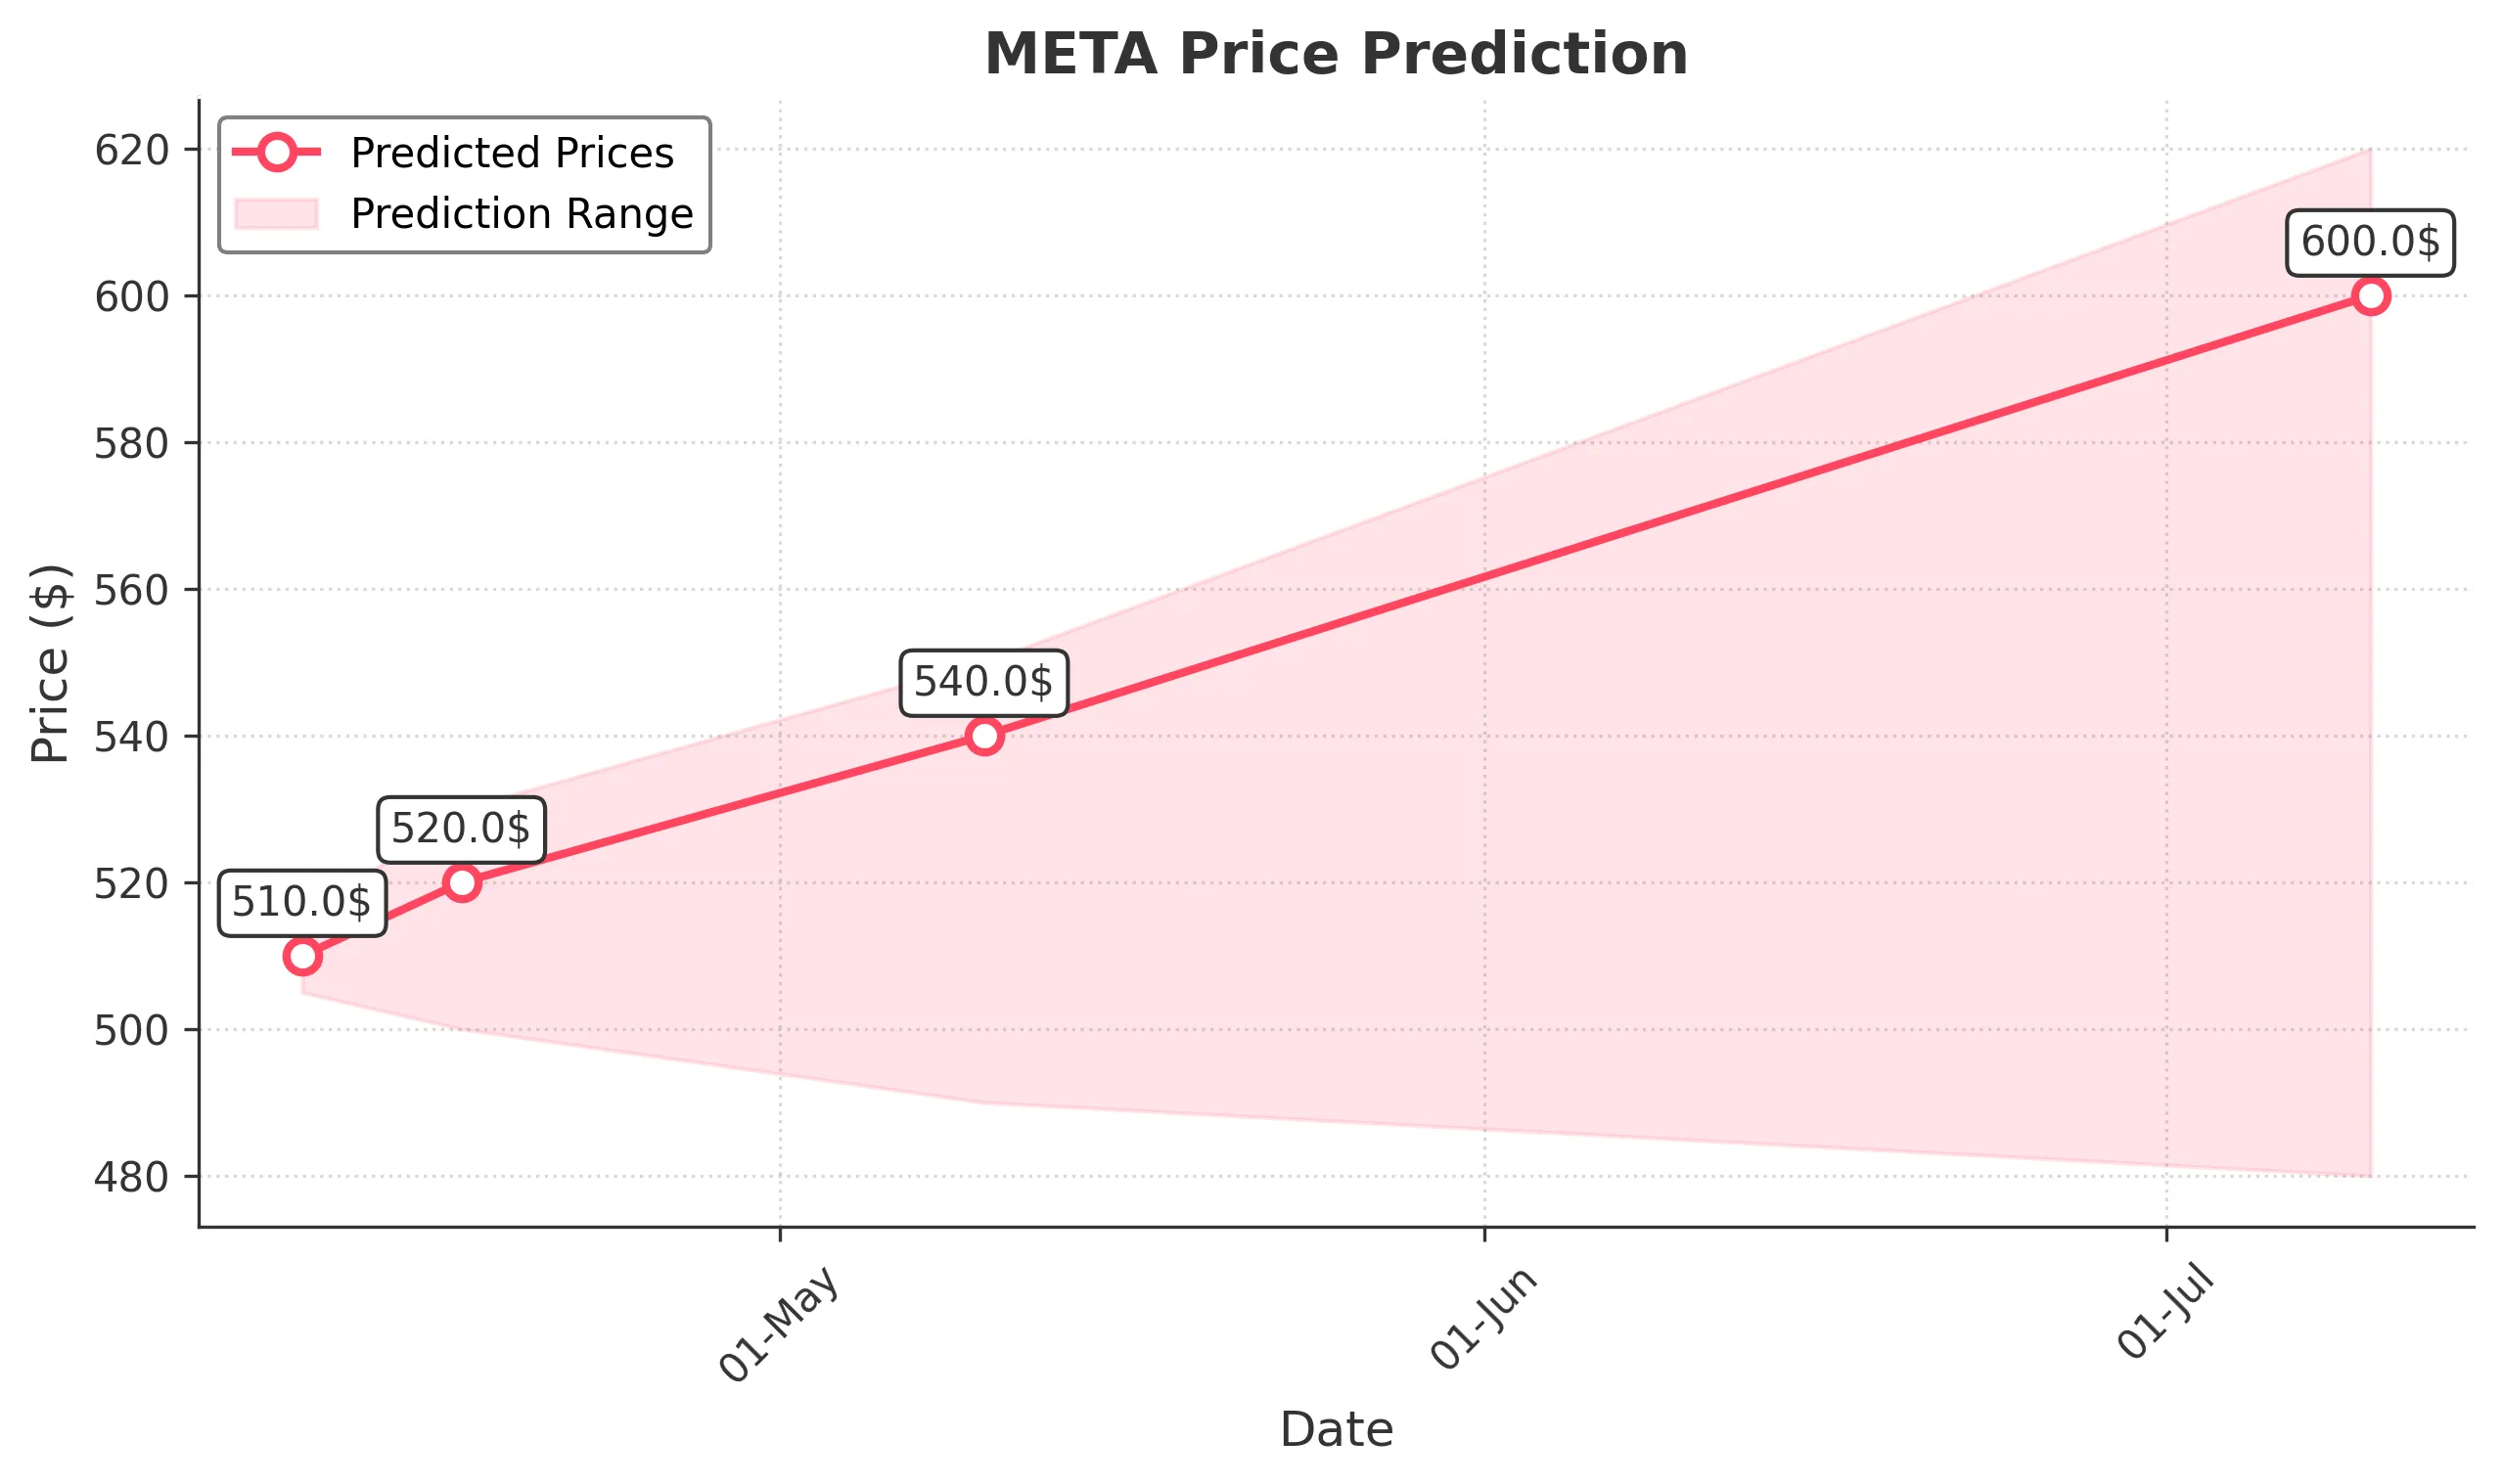
Target: April 10, 2025$510
$511
$515
$505
Description
The stock shows bearish momentum with a recent downtrend. The RSI indicates oversold conditions, but a potential bounce could occur. Volume remains high, suggesting continued interest. Watch for support around 505.
Analysis
Over the past 3 months, META has experienced significant volatility, with a bearish trend recently. Key support is around 505, while resistance is near 515. The MACD shows a bearish crossover, and the ATR indicates high volatility.
Confidence Level
Potential Risks
Market volatility and external news could impact the prediction. A sudden bullish reversal is possible if sentiment shifts.
1 Week Prediction
Target: April 17, 2025$520
$510
$530
$500
Description
A potential recovery is anticipated as the stock may find support at 505. The RSI is improving, indicating a possible reversal. However, resistance at 530 could limit gains.
Analysis
The stock has shown a bearish trend recently, with significant volume spikes indicating selling pressure. The MACD is still bearish, but a potential reversal could occur if support holds.
Confidence Level
Potential Risks
Uncertainty remains due to macroeconomic factors and potential earnings reports that could sway market sentiment.
1 Month Prediction
Target: May 10, 2025$540
$520
$550
$490
Description
If the stock maintains support at 505, a gradual recovery towards 540 is possible. The RSI may stabilize, and if bullish sentiment returns, we could see a test of 550.
Analysis
The stock has been in a bearish phase, with significant resistance at 550. The ATR indicates high volatility, and the MACD remains bearish. Volume patterns suggest cautious trading.
Confidence Level
Potential Risks
Market conditions are unpredictable, and external factors could lead to further declines or volatility.
3 Months Prediction
Target: July 10, 2025$600
$580
$620
$480
Description
If the stock can break above 550, a bullish trend may develop, targeting 600. However, significant resistance remains, and external factors could impact this outlook.
Analysis
The stock has faced a bearish trend, with key support at 480 and resistance at 550. The MACD is bearish, and the RSI indicates oversold conditions. Future performance will depend on market sentiment and external influences.
Confidence Level
Potential Risks
Long-term predictions are uncertain due to potential market shifts and economic conditions that could affect performance.