META Trading Predictions
1 Day Prediction
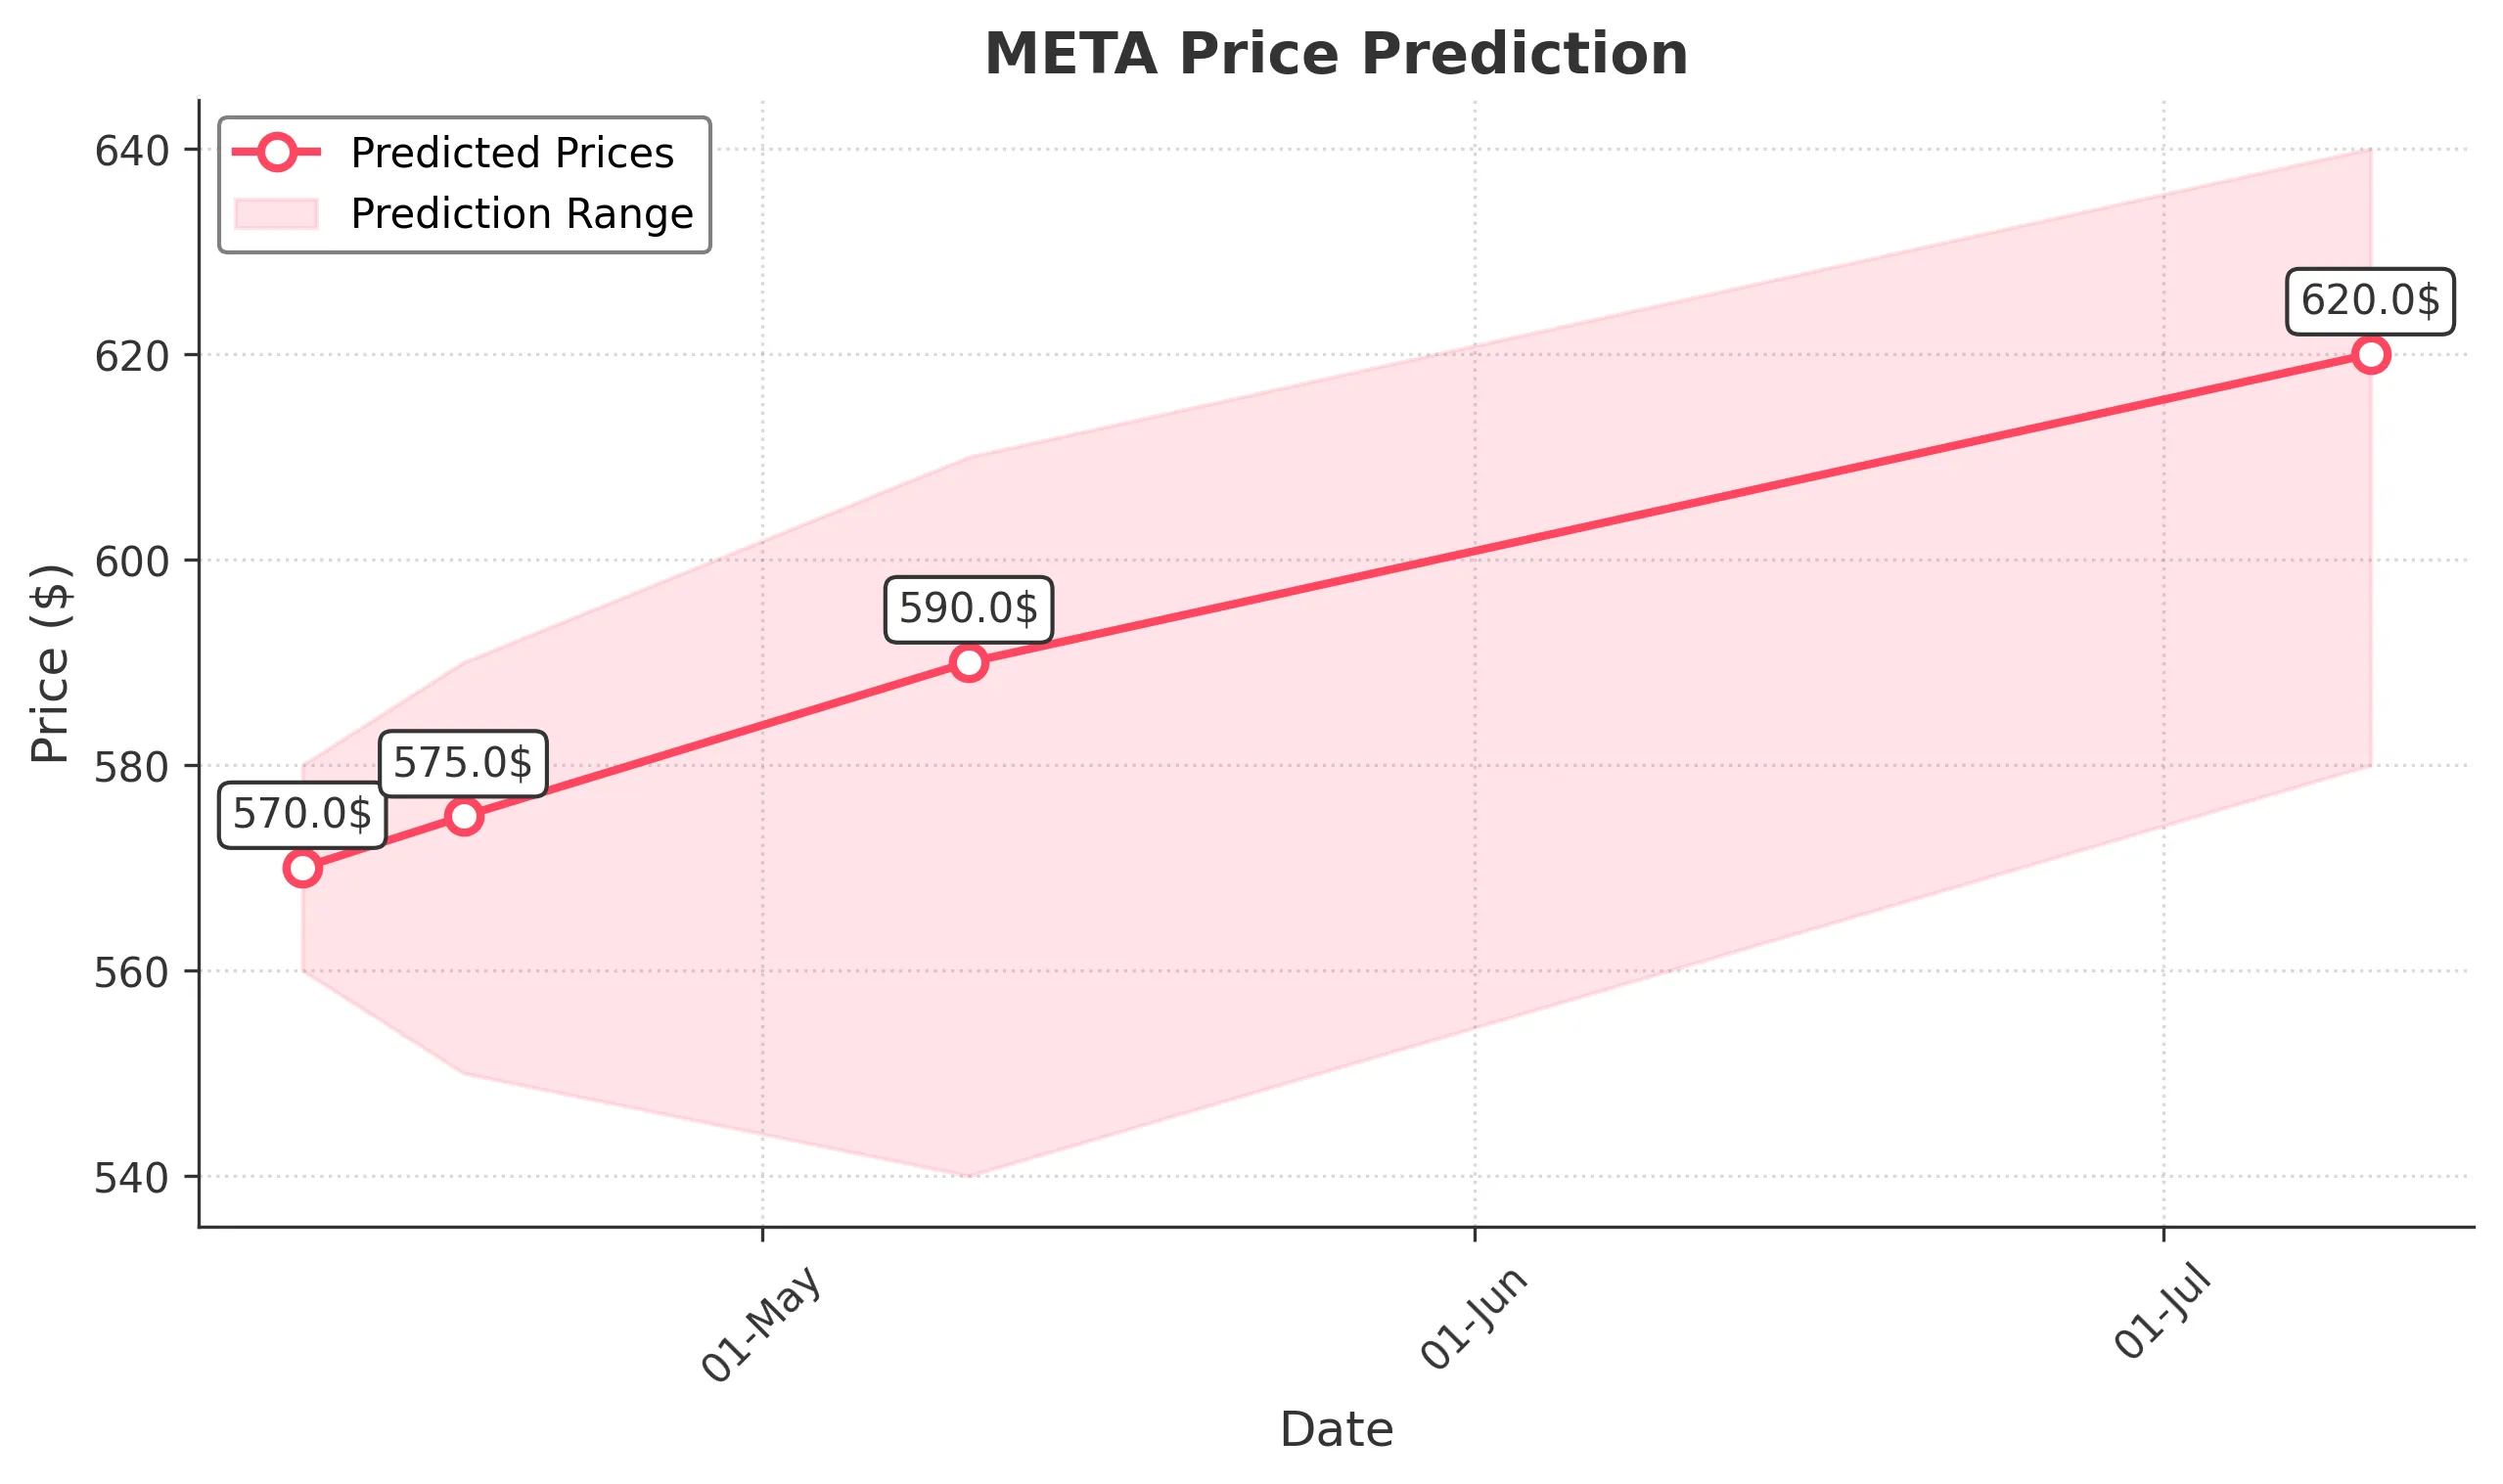
Target: April 11, 2025$570
$572
$580
$560
Description
The stock shows a slight recovery after recent declines, supported by a bullish divergence in the RSI. However, the MACD indicates potential bearish momentum. Expect volatility due to recent high trading volumes.
Analysis
Over the past 3 months, META has experienced significant volatility, with a bearish trend recently. Key support at 500 and resistance at 600. The RSI is near oversold, suggesting a potential bounce, but MACD indicates bearish momentum.
Confidence Level
Potential Risks
Market sentiment remains fragile, and any negative news could reverse this trend.
1 Week Prediction
Target: April 18, 2025$575
$570
$590
$550
Description
A potential short-term recovery is expected as the stock approaches key support levels. However, the overall trend remains bearish, and caution is advised due to high volatility.
Analysis
The stock has shown a bearish trend with significant volume spikes during declines. Key support at 550 and resistance at 600. The ATR indicates high volatility, and the market sentiment is cautious.
Confidence Level
Potential Risks
Uncertainty in macroeconomic conditions could impact the stock's performance.
1 Month Prediction
Target: May 10, 2025$590
$580
$610
$540
Description
Expect a gradual recovery as the stock tests resistance levels. The RSI may stabilize, indicating a potential bullish reversal, but macroeconomic factors could hinder growth.
Analysis
The stock has been in a bearish phase, with significant resistance at 600. The recent price action suggests a potential bottoming pattern, but external factors could influence the recovery.
Confidence Level
Potential Risks
Economic indicators and earnings reports could lead to unexpected volatility.
3 Months Prediction
Target: July 10, 2025$620
$610
$640
$580
Description
A longer-term bullish outlook is anticipated if the stock can break above resistance levels. The market may react positively to upcoming earnings, but caution is warranted due to potential market corrections.
Analysis
The stock has shown a bearish trend recently, but potential bullish signals are emerging. Key resistance at 600 and support at 550. The market sentiment is mixed, with external factors influencing volatility.
Confidence Level
Potential Risks
Market corrections and economic uncertainties could impact the stock's trajectory.