META Trading Predictions
1 Day Prediction
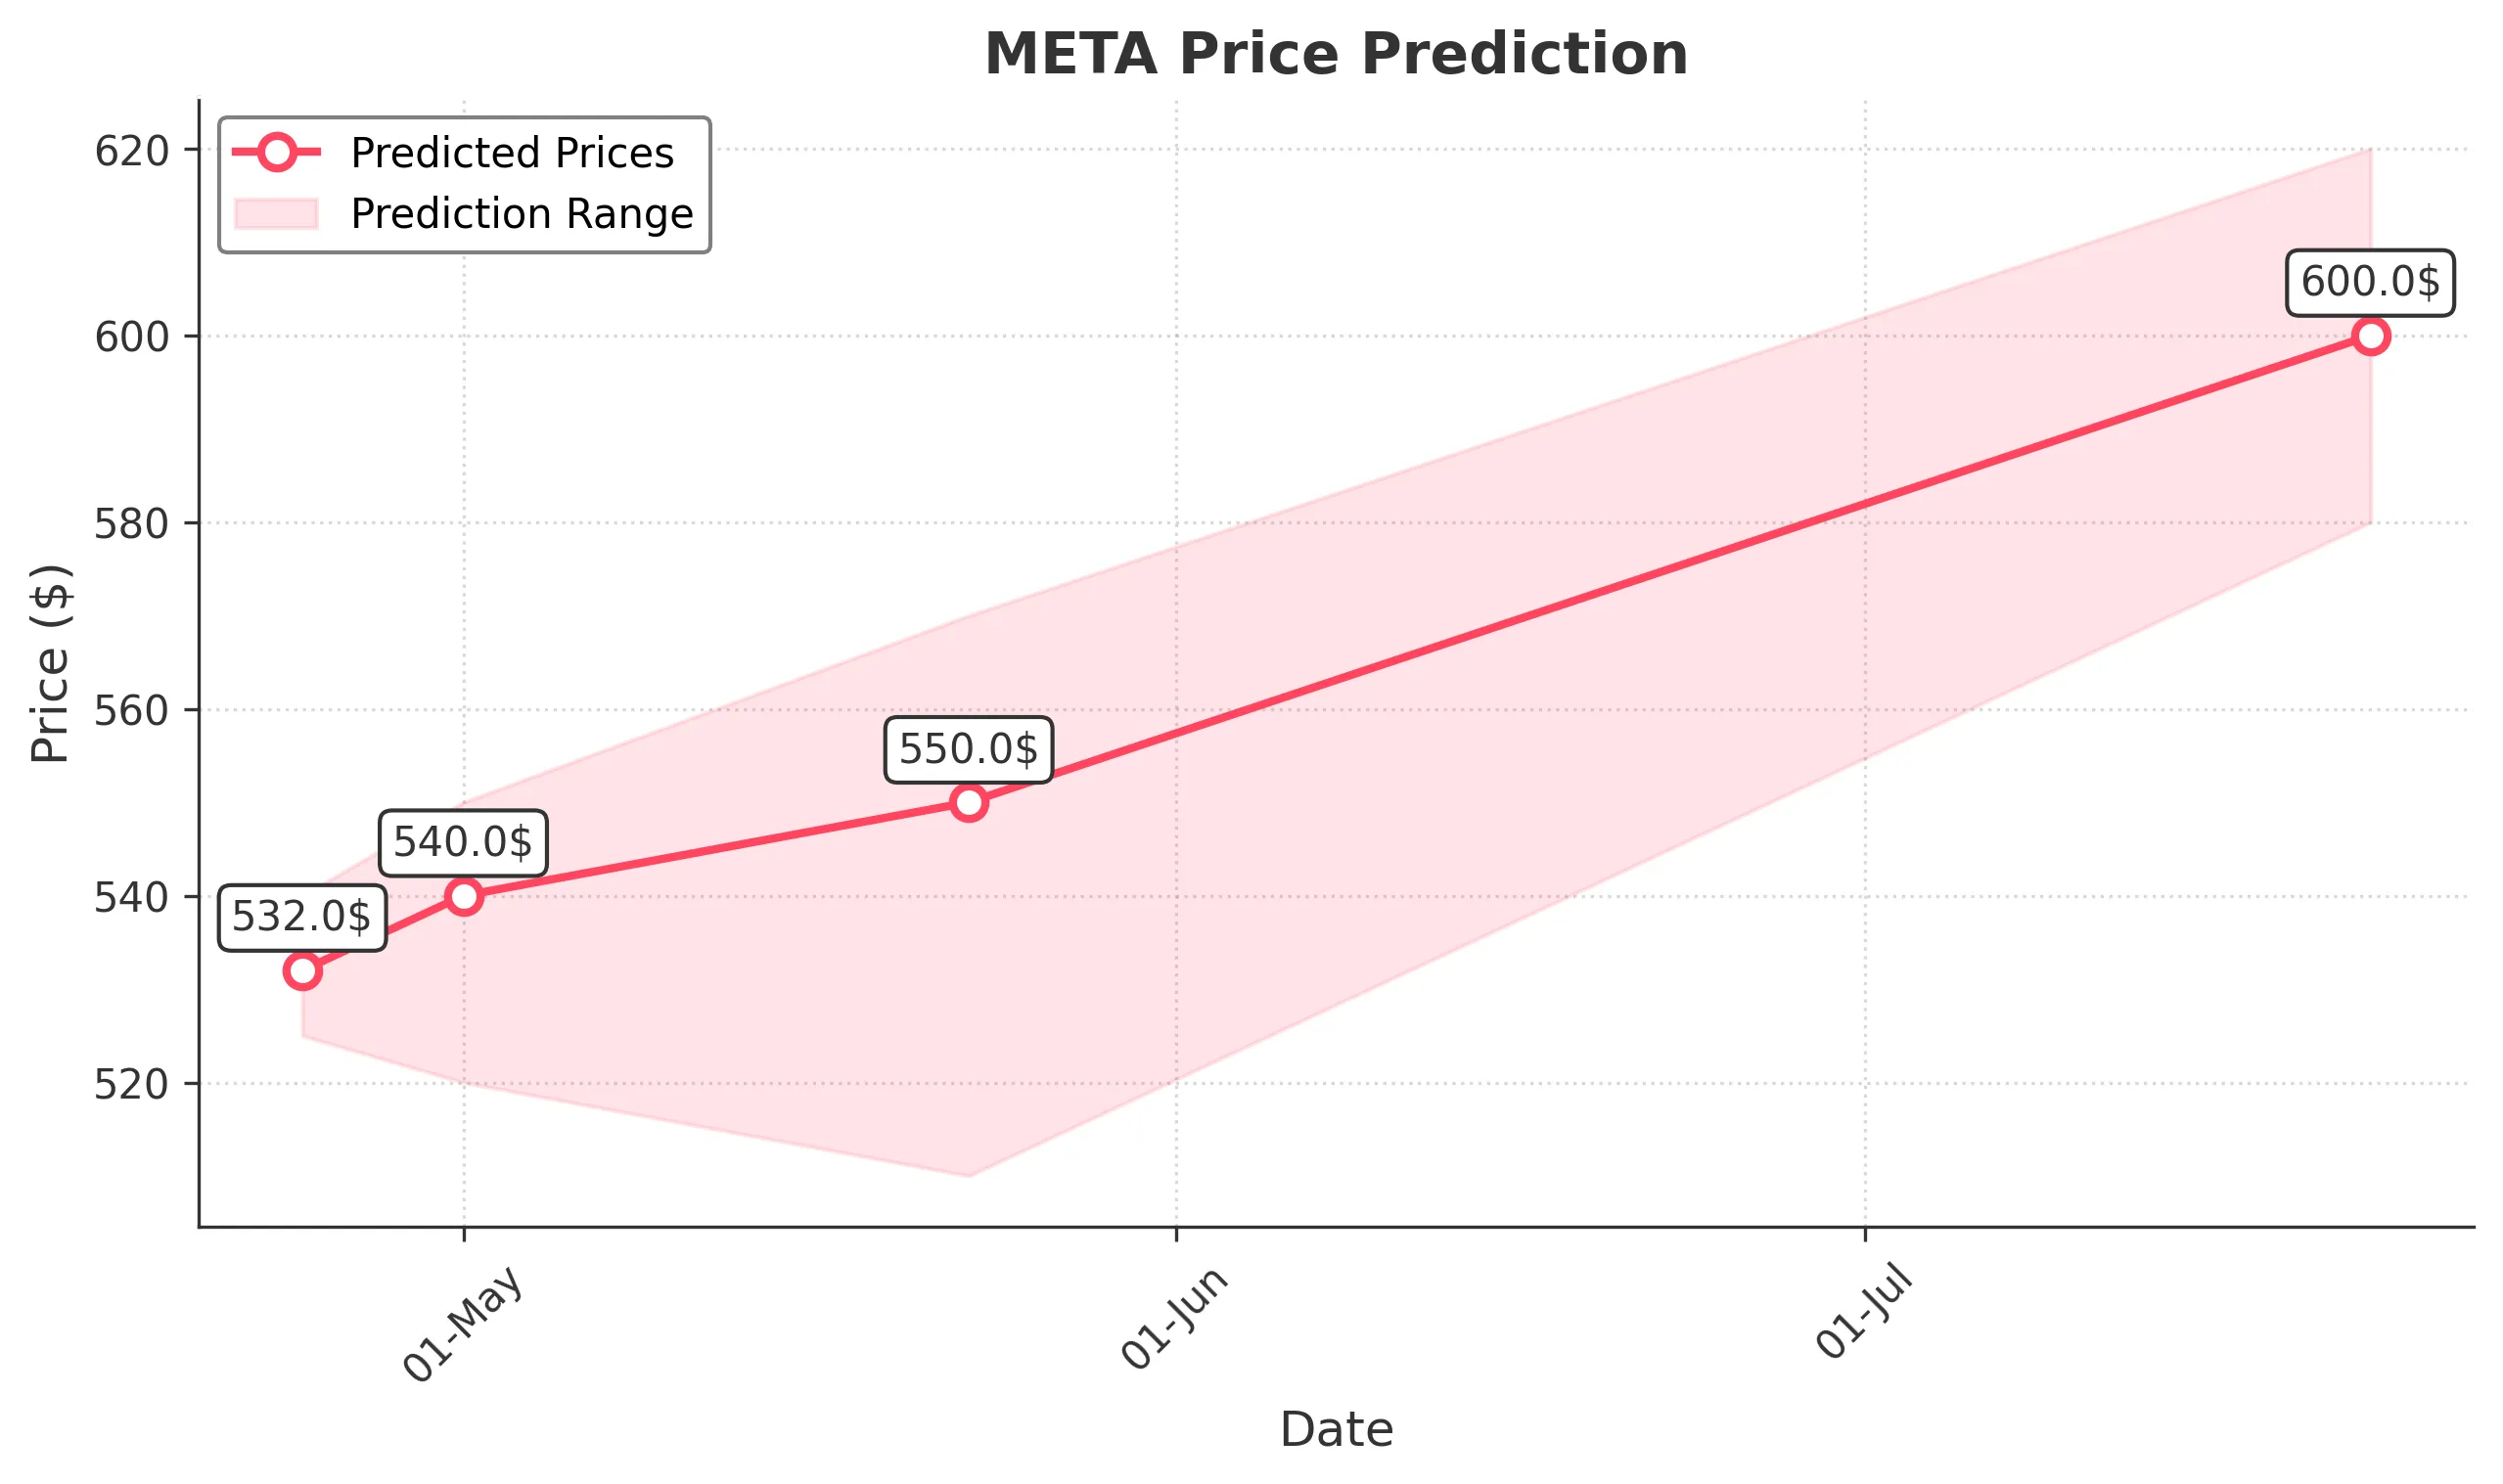
Target: April 24, 2025$532
$530
$540
$525
Description
The stock shows a slight bullish trend with a potential bounce from recent support around 530. The RSI is neutral, and MACD indicates a possible upward momentum. However, volatility remains high, suggesting caution.
Analysis
Over the past 3 months, META has experienced significant volatility, with a bearish trend recently. Key support at 530 has held, but resistance at 550 remains strong. Volume spikes indicate potential reversals, while the MACD and RSI suggest indecision.
Confidence Level
Potential Risks
Market sentiment could shift quickly due to external news or earnings reports, which may impact the prediction.
1 Week Prediction
Target: May 1, 2025$540
$532
$550
$520
Description
A potential recovery is indicated as the stock approaches resistance at 550. The Bollinger Bands suggest a tightening range, which may lead to a breakout. However, the overall market sentiment remains cautious.
Analysis
The stock has shown a bearish trend recently, with significant support at 530. The RSI is approaching oversold levels, indicating a potential bounce. However, the overall market sentiment remains mixed, and external factors could influence price movements.
Confidence Level
Potential Risks
Unforeseen macroeconomic events or earnings surprises could lead to increased volatility and impact the stock's performance.
1 Month Prediction
Target: May 23, 2025$550
$540
$570
$510
Description
The stock may stabilize around 550 as it tests resistance levels. The MACD shows signs of bullish divergence, while the RSI indicates potential upward momentum. However, caution is advised due to market volatility.
Analysis
META has faced significant fluctuations, with a recent bearish trend. Key resistance at 550 and support at 530 are critical levels. The MACD and RSI suggest potential recovery, but external factors could lead to further declines.
Confidence Level
Potential Risks
Market conditions can change rapidly, and any negative news could reverse the current trend, impacting the prediction.
3 Months Prediction
Target: July 23, 2025$600
$590
$620
$580
Description
If the stock can break through resistance at 550, it may rally towards 600. The overall trend could shift bullish if positive market sentiment prevails, but caution is warranted due to potential volatility.
Analysis
The stock has been in a bearish phase recently, with significant resistance at 550. The potential for recovery exists if market sentiment improves. However, external economic factors and company performance will play a crucial role in future price movements.
Confidence Level
Potential Risks
Long-term predictions are uncertain due to potential market shifts, economic conditions, and company performance that could affect stock price.