META Trading Predictions
1 Day Prediction
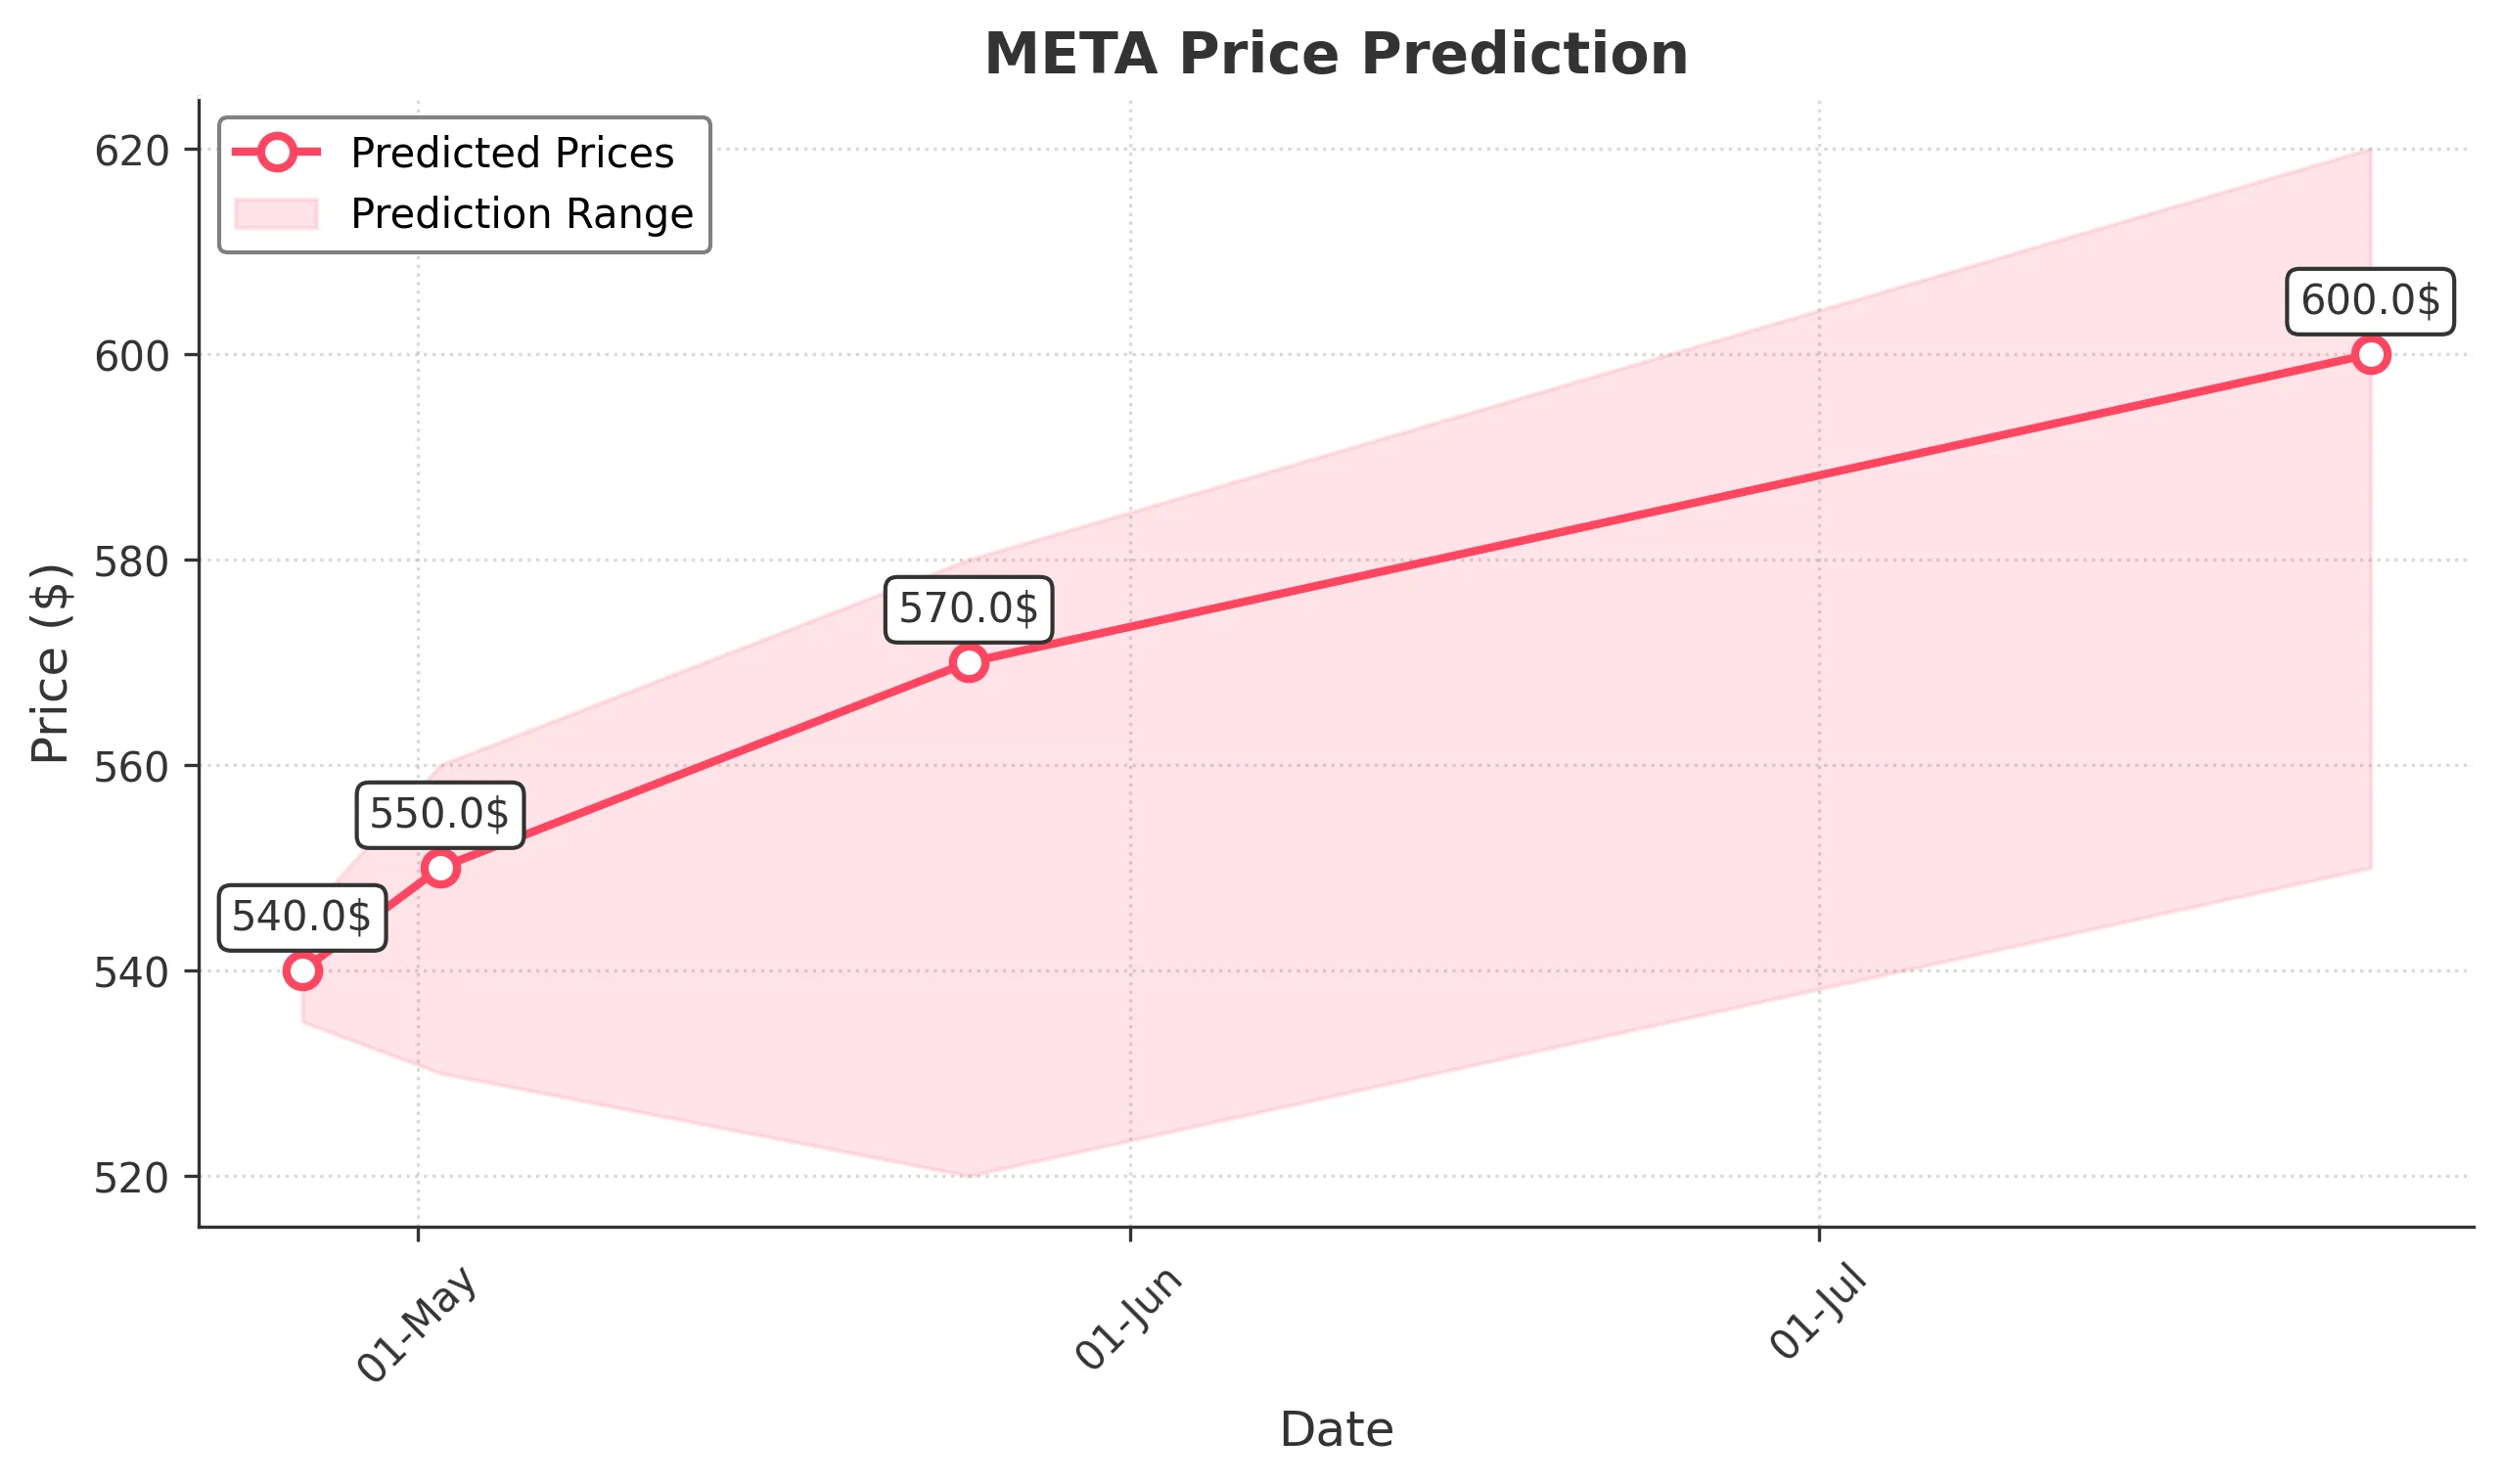
Target: April 26, 2025$540
$538
$545
$535
Description
The stock shows a slight bullish trend with a potential bounce from recent support levels around 535. The RSI indicates oversold conditions, suggesting a possible short-term recovery. However, volatility remains high, and market sentiment is mixed.
Analysis
Over the past 3 months, META has experienced significant volatility, with a bearish trend recently. Key support is around 535, while resistance is near 550. The MACD shows a bearish crossover, and the ATR indicates high volatility. Volume spikes suggest potential accumulation, but overall sentiment remains cautious.
Confidence Level
Potential Risks
Market volatility and external news could impact the prediction. A bearish reversal is possible if selling pressure continues.
1 Week Prediction
Target: May 2, 2025$550
$540
$560
$530
Description
A potential recovery is anticipated as the stock approaches key support levels. The RSI is improving, indicating a possible reversal. However, the MACD remains bearish, suggesting caution. Volume trends indicate increased interest, but external factors could sway the market.
Analysis
The stock has been in a bearish phase, with significant price drops. Support at 530 is critical, while resistance is at 560. The Bollinger Bands indicate potential for a bounce, but the overall trend remains uncertain. Volume analysis shows mixed signals, with some accumulation but also distribution.
Confidence Level
Potential Risks
Unforeseen macroeconomic events or earnings reports could lead to volatility. The bearish MACD signal raises concerns about sustainability.
1 Month Prediction
Target: May 25, 2025$570
$550
$580
$520
Description
A gradual recovery is expected as the stock stabilizes around support levels. The RSI may approach neutral territory, indicating reduced selling pressure. However, the overall market sentiment remains cautious, and external factors could influence price movements.
Analysis
META has shown a bearish trend with significant price fluctuations. Key support at 520 and resistance at 580 are critical. The MACD remains bearish, but the RSI is improving. Volume patterns suggest some accumulation, but overall market sentiment is mixed, indicating uncertainty.
Confidence Level
Potential Risks
Market sentiment and macroeconomic conditions could lead to unexpected volatility. The potential for further declines exists if bearish trends persist.
3 Months Prediction
Target: July 25, 2025$600
$580
$620
$550
Description
A potential recovery trend is anticipated as the stock stabilizes. The RSI may indicate a bullish divergence, suggesting a reversal. However, macroeconomic factors and market sentiment could impact the trajectory.
Analysis
The stock has faced significant challenges, with a bearish trend dominating. Key support at 550 and resistance at 620 are crucial. The MACD shows bearish momentum, while the RSI indicates potential for recovery. Volume analysis suggests mixed signals, with some accumulation but also distribution.
Confidence Level
Potential Risks
Long-term predictions are uncertain due to potential market volatility and external economic influences. A bearish trend could resume if negative news arises.