META Trading Predictions
1 Day Prediction
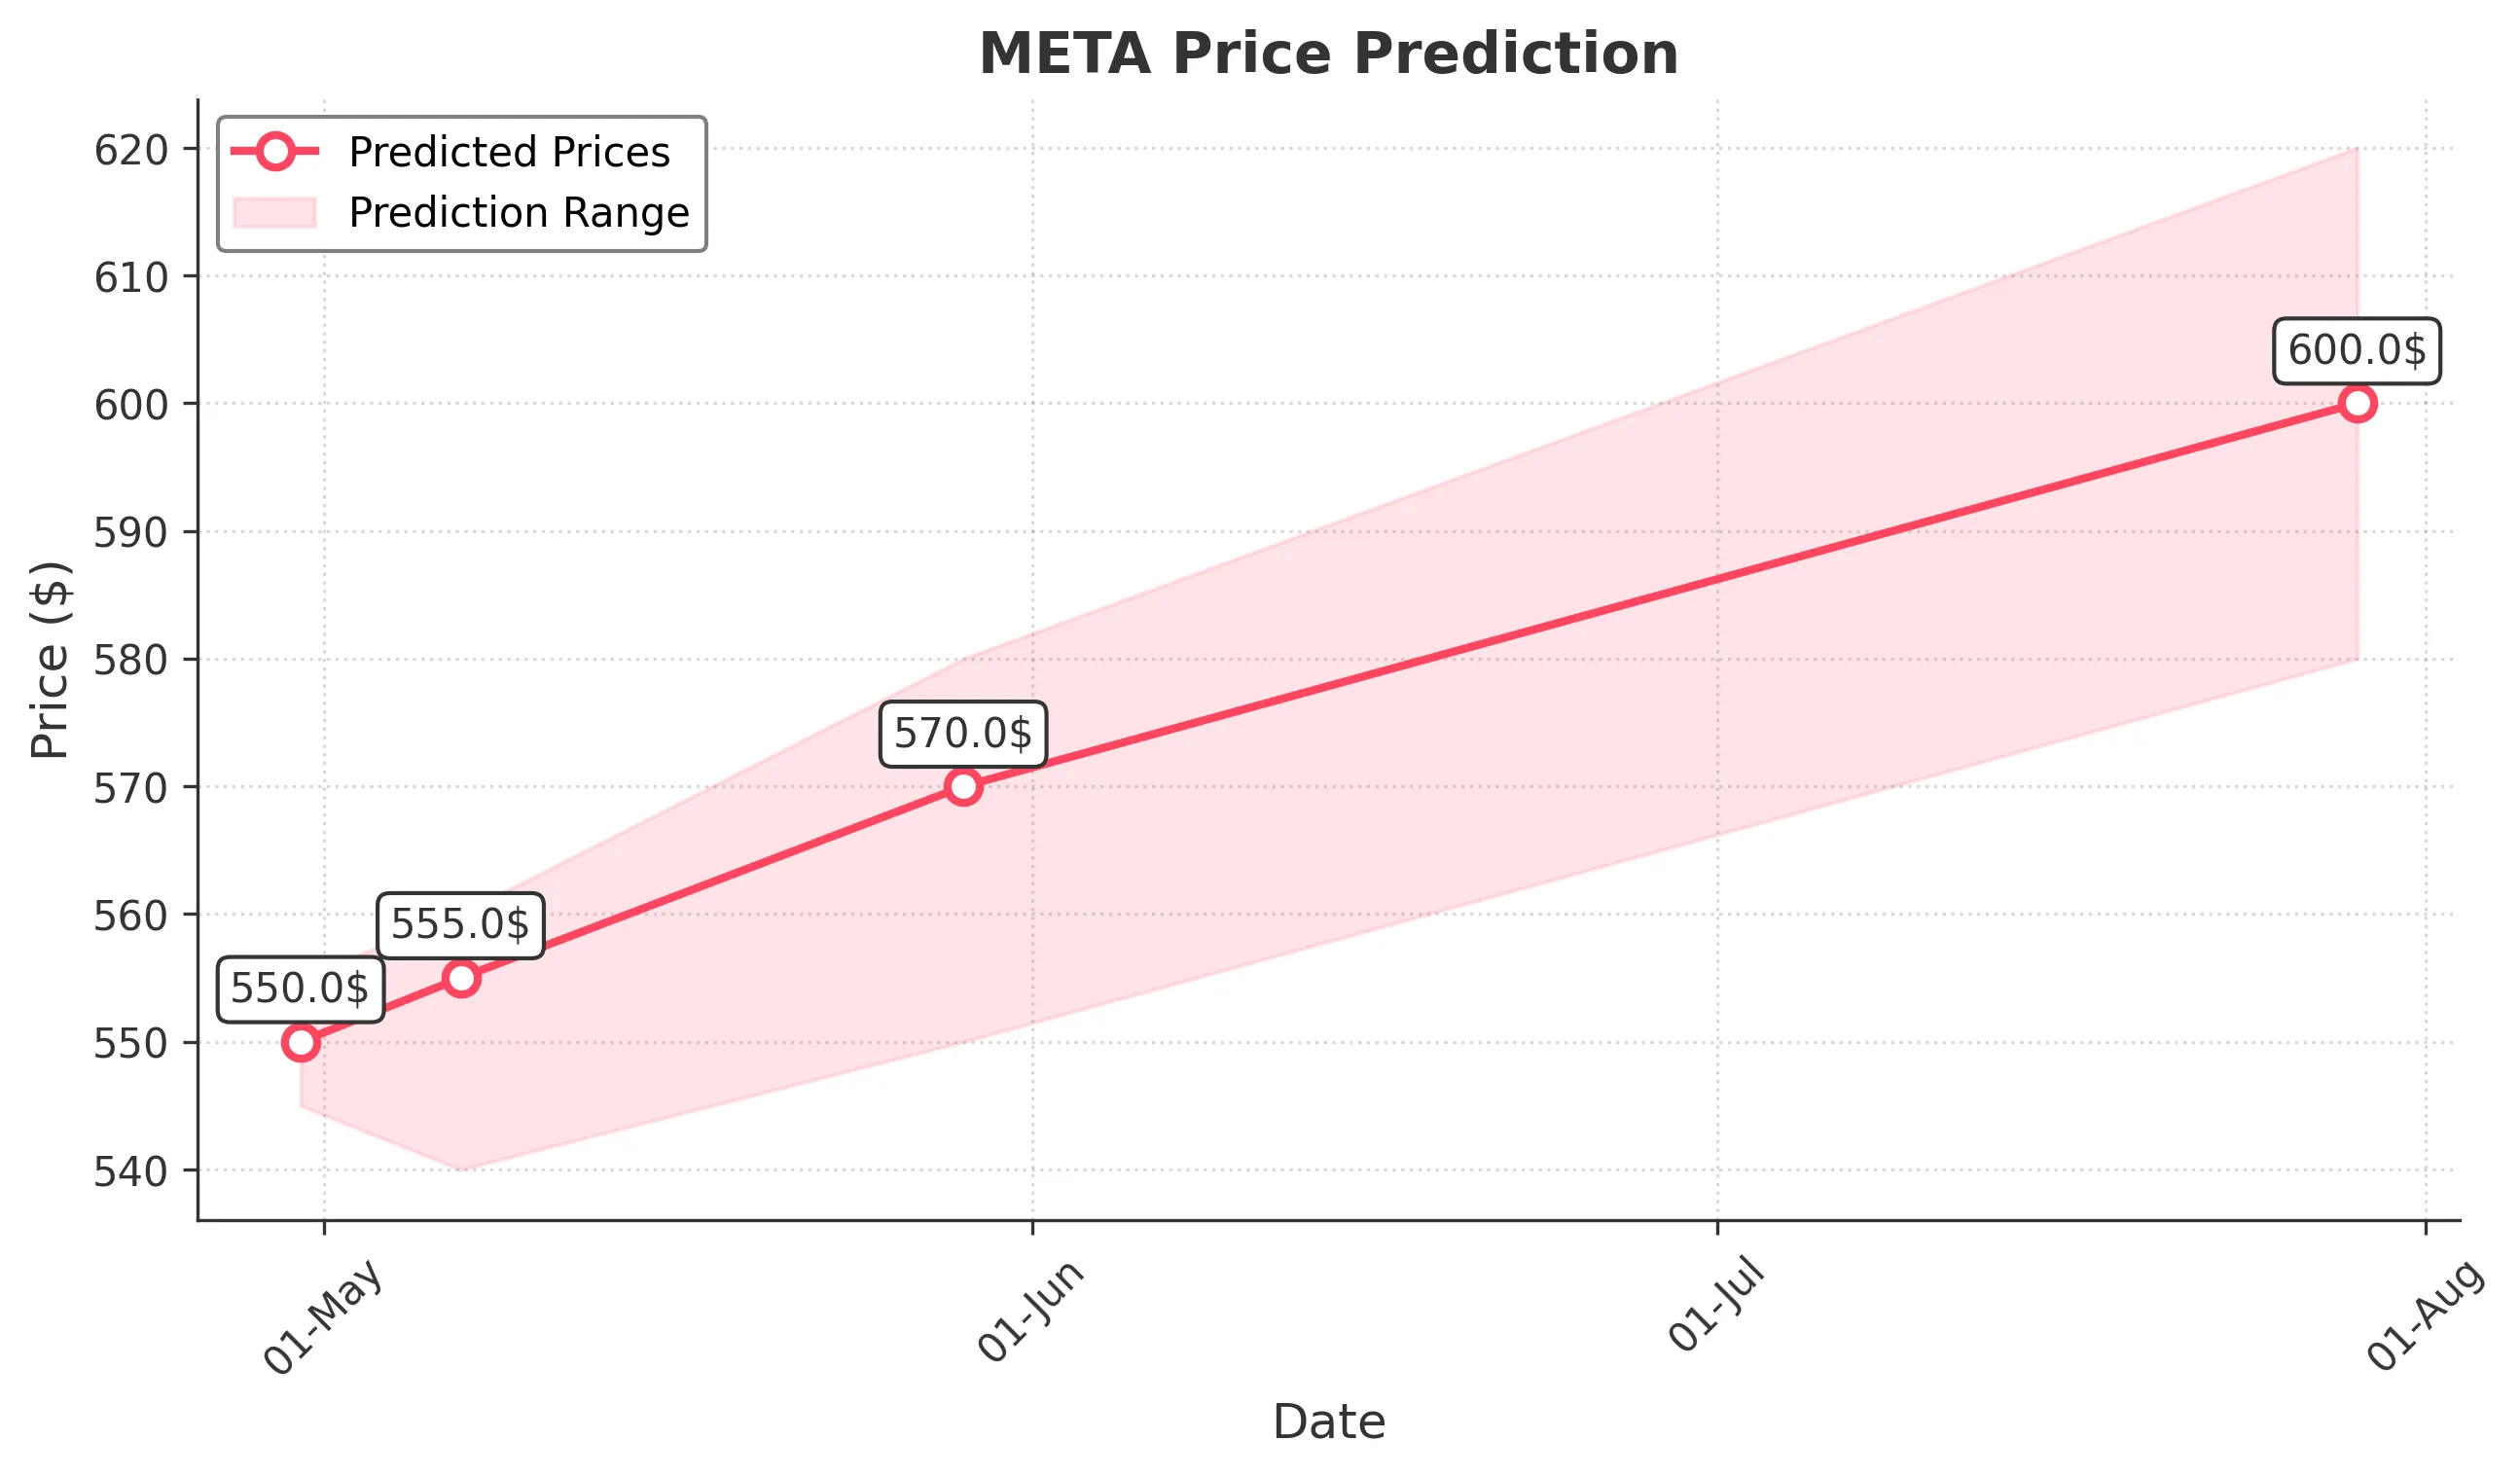
Target: April 30, 2025$550
$548
$555
$545
Description
The stock shows a slight bullish trend with a potential bounce from recent lows. RSI indicates oversold conditions, while MACD is showing a bullish crossover. However, volatility remains high, suggesting caution.
Analysis
Over the past 3 months, META has experienced significant volatility, with a bearish trend recently. Key support at 500 and resistance at 600. Technical indicators show mixed signals, with RSI indicating oversold conditions, while MACD suggests potential bullish momentum. Volume spikes on down days indicate selling pressure.
Confidence Level
Potential Risks
Market sentiment could shift due to macroeconomic news or earnings reports, which may impact the prediction.
1 Week Prediction
Target: May 7, 2025$555
$552
$560
$540
Description
A potential recovery is anticipated as the stock approaches key support levels. The recent candlestick patterns suggest a reversal, but external factors could influence market sentiment.
Analysis
The stock has been in a bearish phase, with significant resistance at 600. Recent price action shows a potential reversal pattern forming. Technical indicators like Bollinger Bands suggest a tightening range, indicating a possible breakout. Volume analysis shows increased activity on down days.
Confidence Level
Potential Risks
Uncertainty in the broader market and potential earnings surprises could lead to unexpected price movements.
1 Month Prediction
Target: May 29, 2025$570
$560
$580
$550
Description
Expect a gradual recovery as the stock stabilizes. The bullish divergence in RSI and MACD suggests potential upward momentum, but caution is advised due to market volatility.
Analysis
META has shown a bearish trend recently, with significant support at 500. The stock's performance has been influenced by macroeconomic factors, and technical indicators suggest a potential reversal. Volume patterns indicate selling pressure, but a recovery could be on the horizon.
Confidence Level
Potential Risks
Market conditions and external economic factors could lead to unexpected downturns, impacting the prediction.
3 Months Prediction
Target: July 29, 2025$600
$590
$620
$580
Description
A longer-term bullish outlook is anticipated as the stock may recover from recent lows. Key resistance levels will need to be monitored closely.
Analysis
The stock has been in a bearish trend, but signs of recovery are emerging. Key resistance at 600 and support at 500 are critical levels to watch. Technical indicators show mixed signals, and external factors could significantly impact future performance.
Confidence Level
Potential Risks
Long-term predictions are subject to high uncertainty due to potential market shifts and economic conditions.