META Trading Predictions
1 Day Prediction
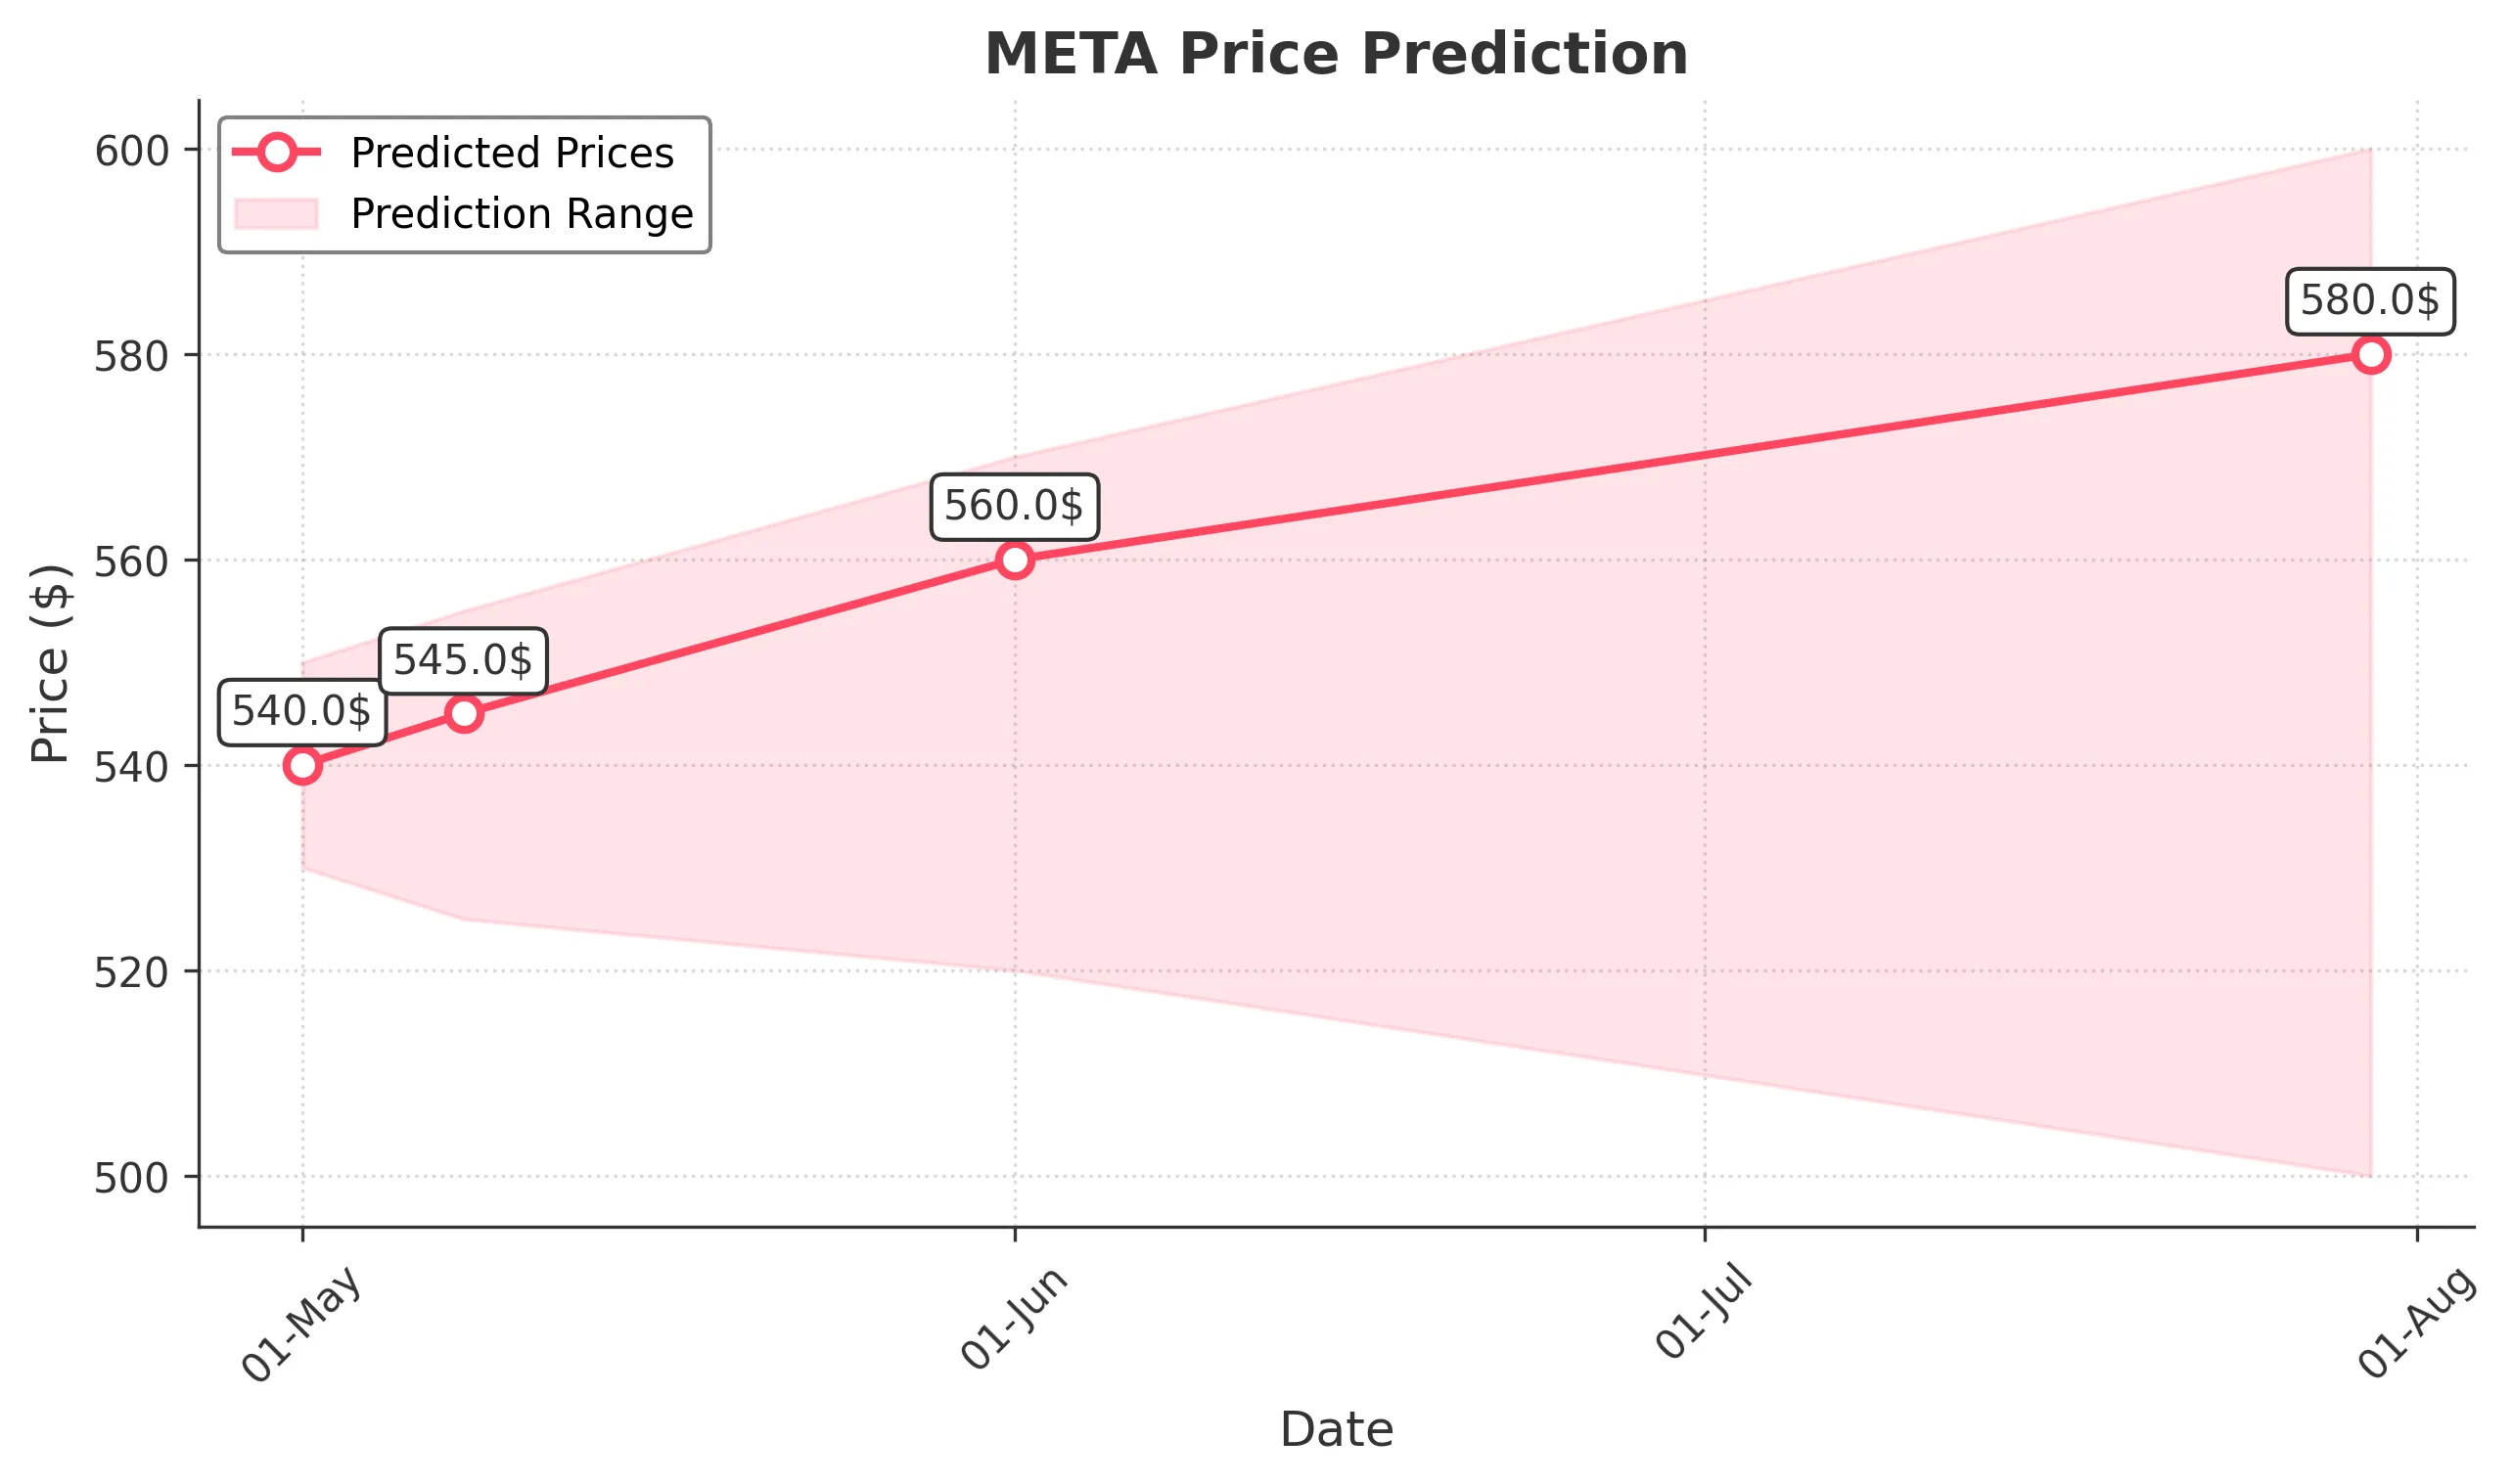
Target: May 1, 2025$540
$537.34
$550
$530
Description
The stock shows a slight bullish trend with a potential bounce from recent lows. RSI indicates oversold conditions, while MACD is showing a bullish crossover. However, volatility remains high, suggesting caution.
Analysis
Over the past 3 months, META has experienced significant volatility, with a bearish trend recently. Key support at 530.00 and resistance at 550.00. Volume spikes indicate potential reversals, but overall sentiment remains cautious.
Confidence Level
Potential Risks
Market sentiment could shift quickly due to macroeconomic news or earnings reports, which may impact the prediction.
1 Week Prediction
Target: May 8, 2025$545
$540
$555
$525
Description
Expect a gradual recovery as the stock may find support around 530.00. The bullish divergence in RSI suggests potential upward momentum, but external factors could hinder progress.
Analysis
The stock has been in a bearish phase, with recent lows indicating a need for a correction. Key resistance at 555.00 and support at 525.00. Volume analysis shows increased activity, hinting at possible reversals.
Confidence Level
Potential Risks
Uncertainty in market conditions and potential earnings surprises could lead to unexpected price movements.
1 Month Prediction
Target: June 1, 2025$560
$545
$570
$520
Description
A potential recovery trend may emerge as the stock stabilizes. The MACD indicates a bullish trend, and the RSI is moving towards neutral territory, suggesting a possible upward trajectory.
Analysis
META has shown signs of recovery after a bearish trend, with key support at 520.00 and resistance at 570.00. Volume patterns indicate increased interest, but macroeconomic factors remain a concern.
Confidence Level
Potential Risks
Market volatility and external economic factors could impact the stock's performance, leading to fluctuations.
3 Months Prediction
Target: July 30, 2025$580
$560
$600
$500
Description
If the bullish trend continues, the stock could reach 580.00. However, macroeconomic conditions and earnings reports will play a crucial role in determining the actual outcome.
Analysis
The stock has been volatile, with a recent bearish trend. Key support at 500.00 and resistance at 600.00. Technical indicators suggest a potential recovery, but external factors could lead to further declines.
Confidence Level
Potential Risks
Long-term predictions are uncertain due to potential market shifts and economic changes that could affect investor sentiment.