META Trading Predictions
1 Day Prediction
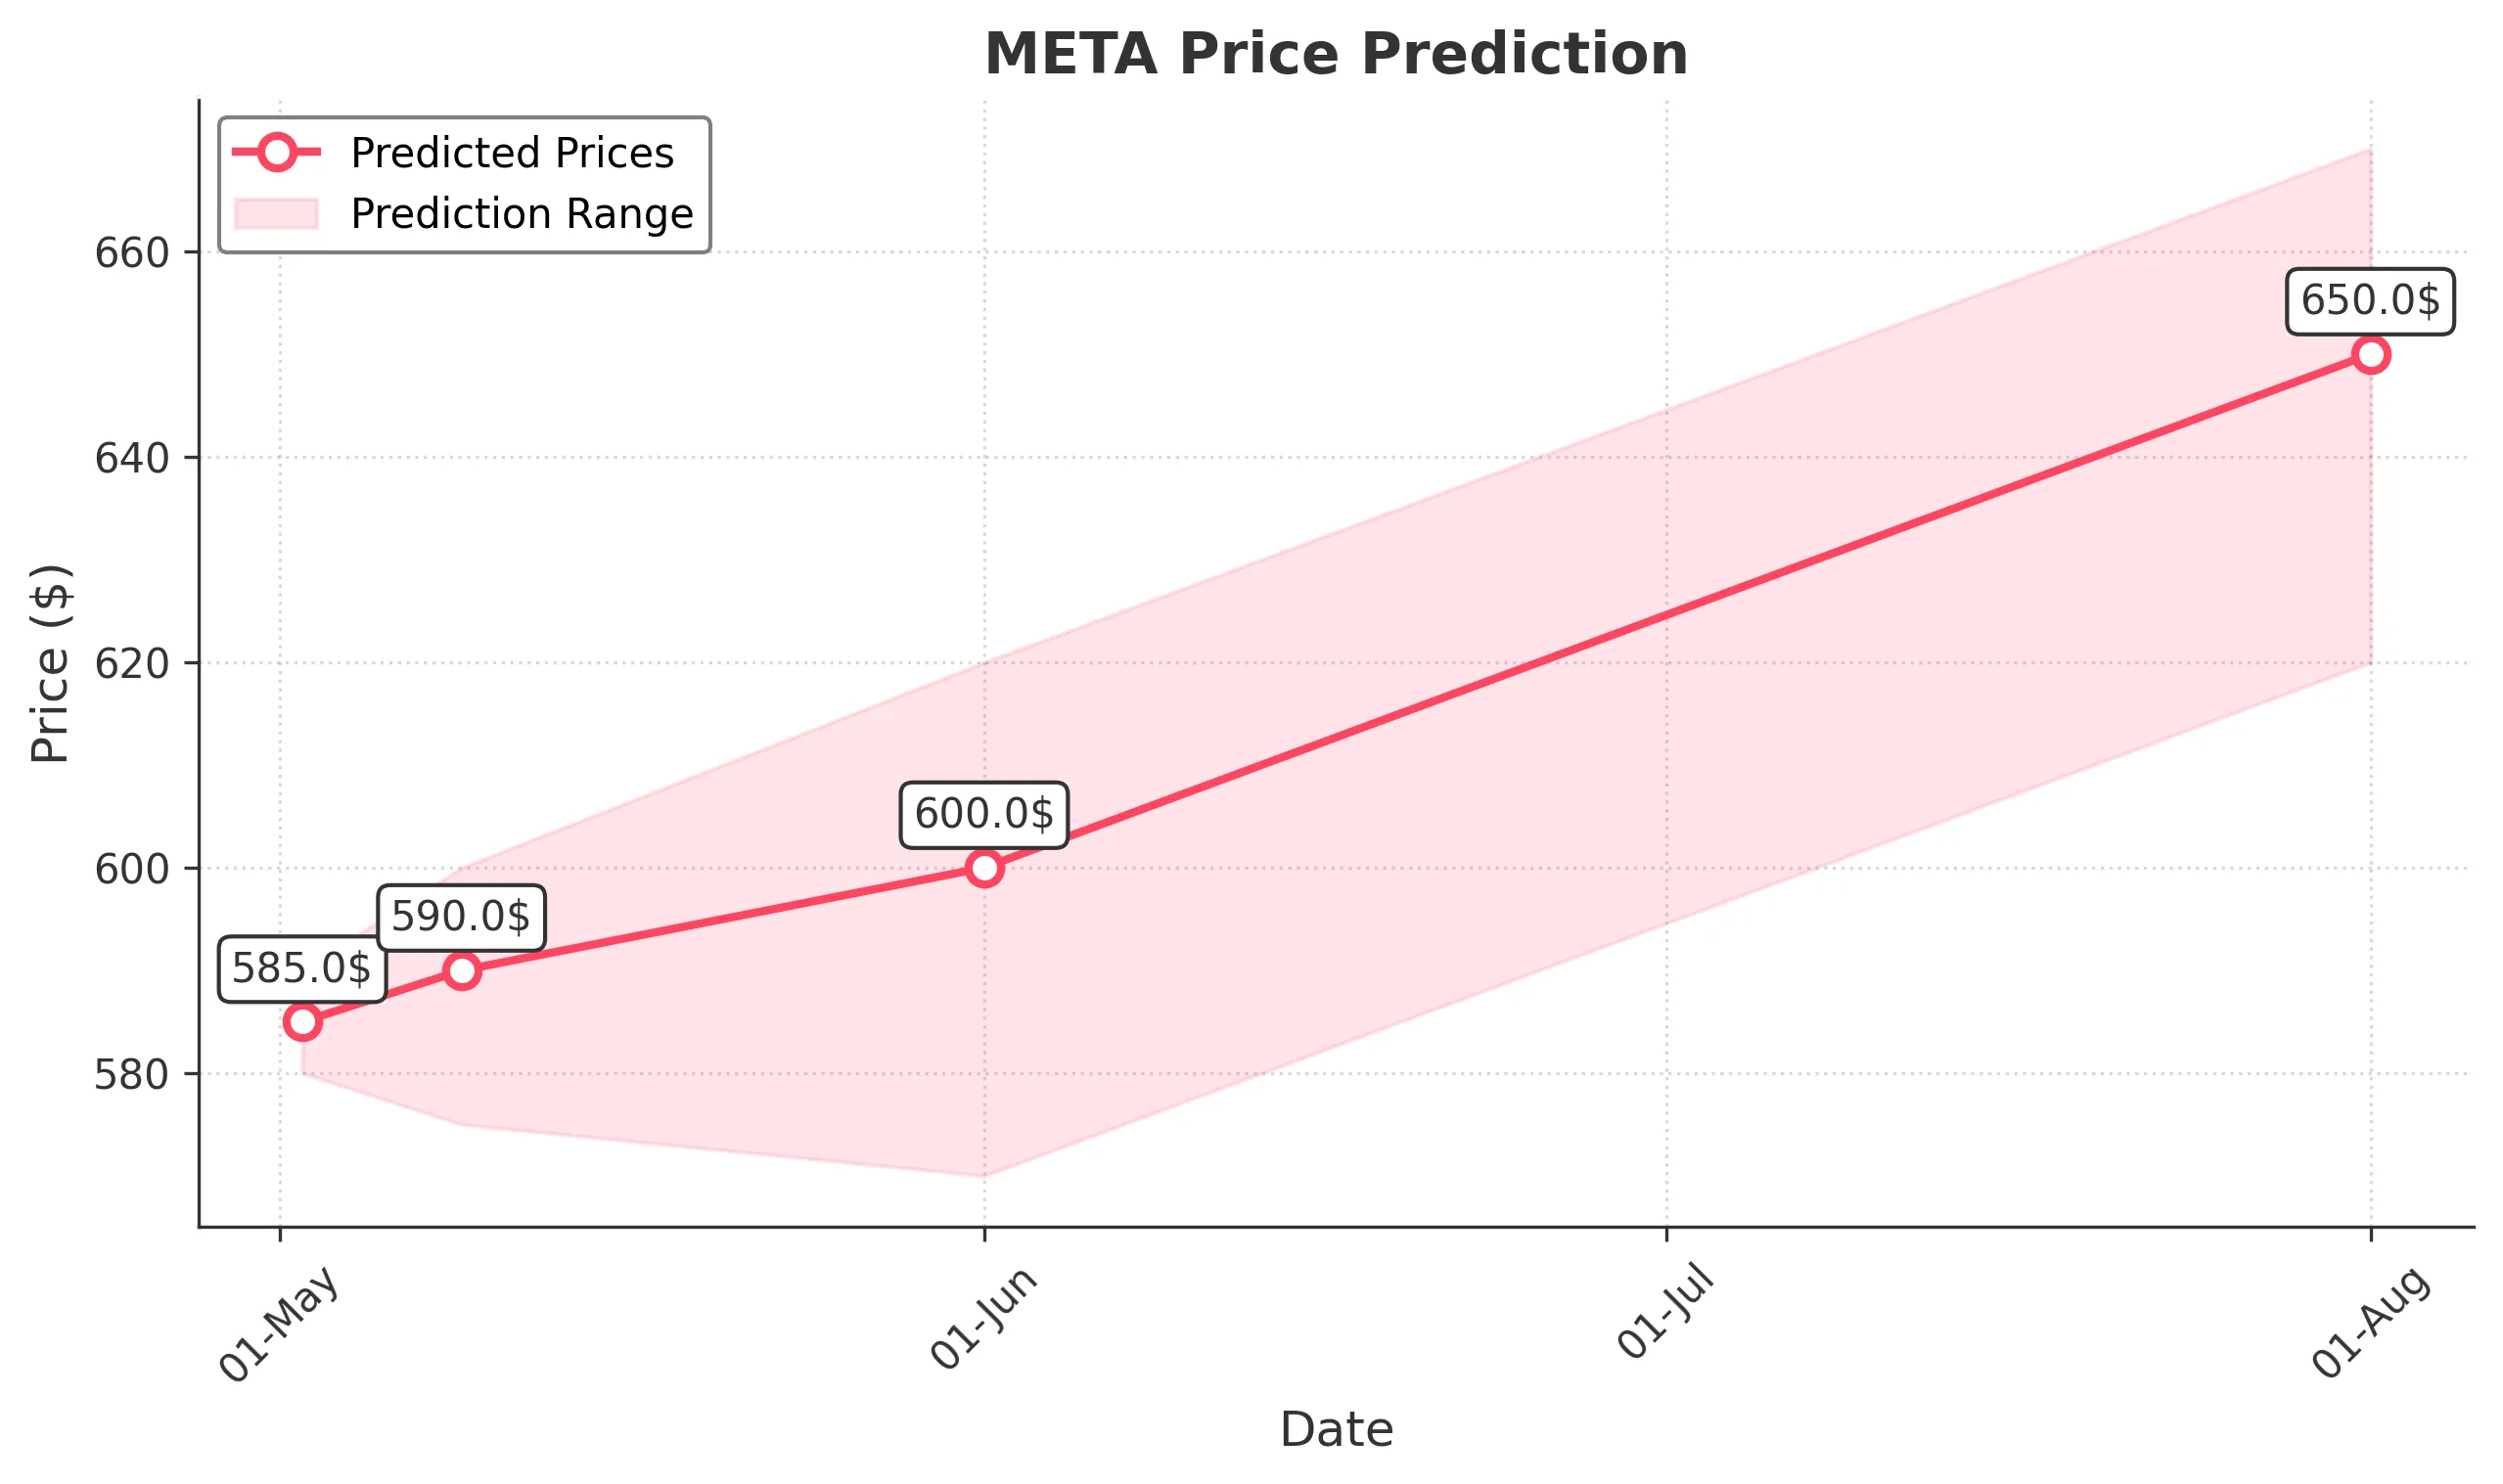
Target: May 2, 2025$585
$583
$590
$580
Description
The stock shows a slight bullish trend with a recent upward movement. The RSI is approaching overbought levels, indicating potential resistance. Volume is expected to be moderate, reflecting cautious optimism.
Analysis
META has shown a bearish trend over the past three months, with significant fluctuations. Key support at 500 and resistance around 600. Recent candlestick patterns suggest indecision, while the MACD indicates a potential bullish crossover.
Confidence Level
Potential Risks
Potential market volatility and profit-taking could lead to a pullback.
1 Week Prediction
Target: May 9, 2025$590
$585
$600
$575
Description
The stock is expected to consolidate around current levels with potential upward movement. The Bollinger Bands are tightening, indicating reduced volatility. However, the RSI suggests caution as it nears overbought territory.
Analysis
Over the past three months, META has experienced significant volatility, with a bearish trend recently. Key support at 500 and resistance at 600. Volume spikes indicate potential interest, but overall sentiment remains cautious.
Confidence Level
Potential Risks
Market sentiment could shift due to macroeconomic news, impacting price stability.
1 Month Prediction
Target: June 1, 2025$600
$590
$620
$570
Description
A gradual recovery is anticipated as the stock approaches key resistance levels. The MACD shows signs of bullish momentum, but the RSI indicates potential overbought conditions. Volume may increase as traders react to market news.
Analysis
META's performance has been characterized by significant fluctuations. The stock is currently testing resistance levels, with key support at 500. Technical indicators suggest a potential bullish reversal, but caution is warranted.
Confidence Level
Potential Risks
Unexpected earnings reports or economic data could lead to volatility.
3 Months Prediction
Target: August 1, 2025$650
$640
$670
$620
Description
Long-term bullish sentiment is expected as the stock breaks through resistance levels. The Fibonacci retracement levels suggest a target around 650. However, market conditions and external factors could influence this trajectory.
Analysis
META has shown a mixed performance over the last three months, with key support at 500 and resistance at 600. The stock's volatility has been pronounced, and while bullish signals are present, external factors could lead to unexpected downturns.
Confidence Level
Potential Risks
Macroeconomic factors and competitive pressures could impact growth.