META Trading Predictions
1 Day Prediction
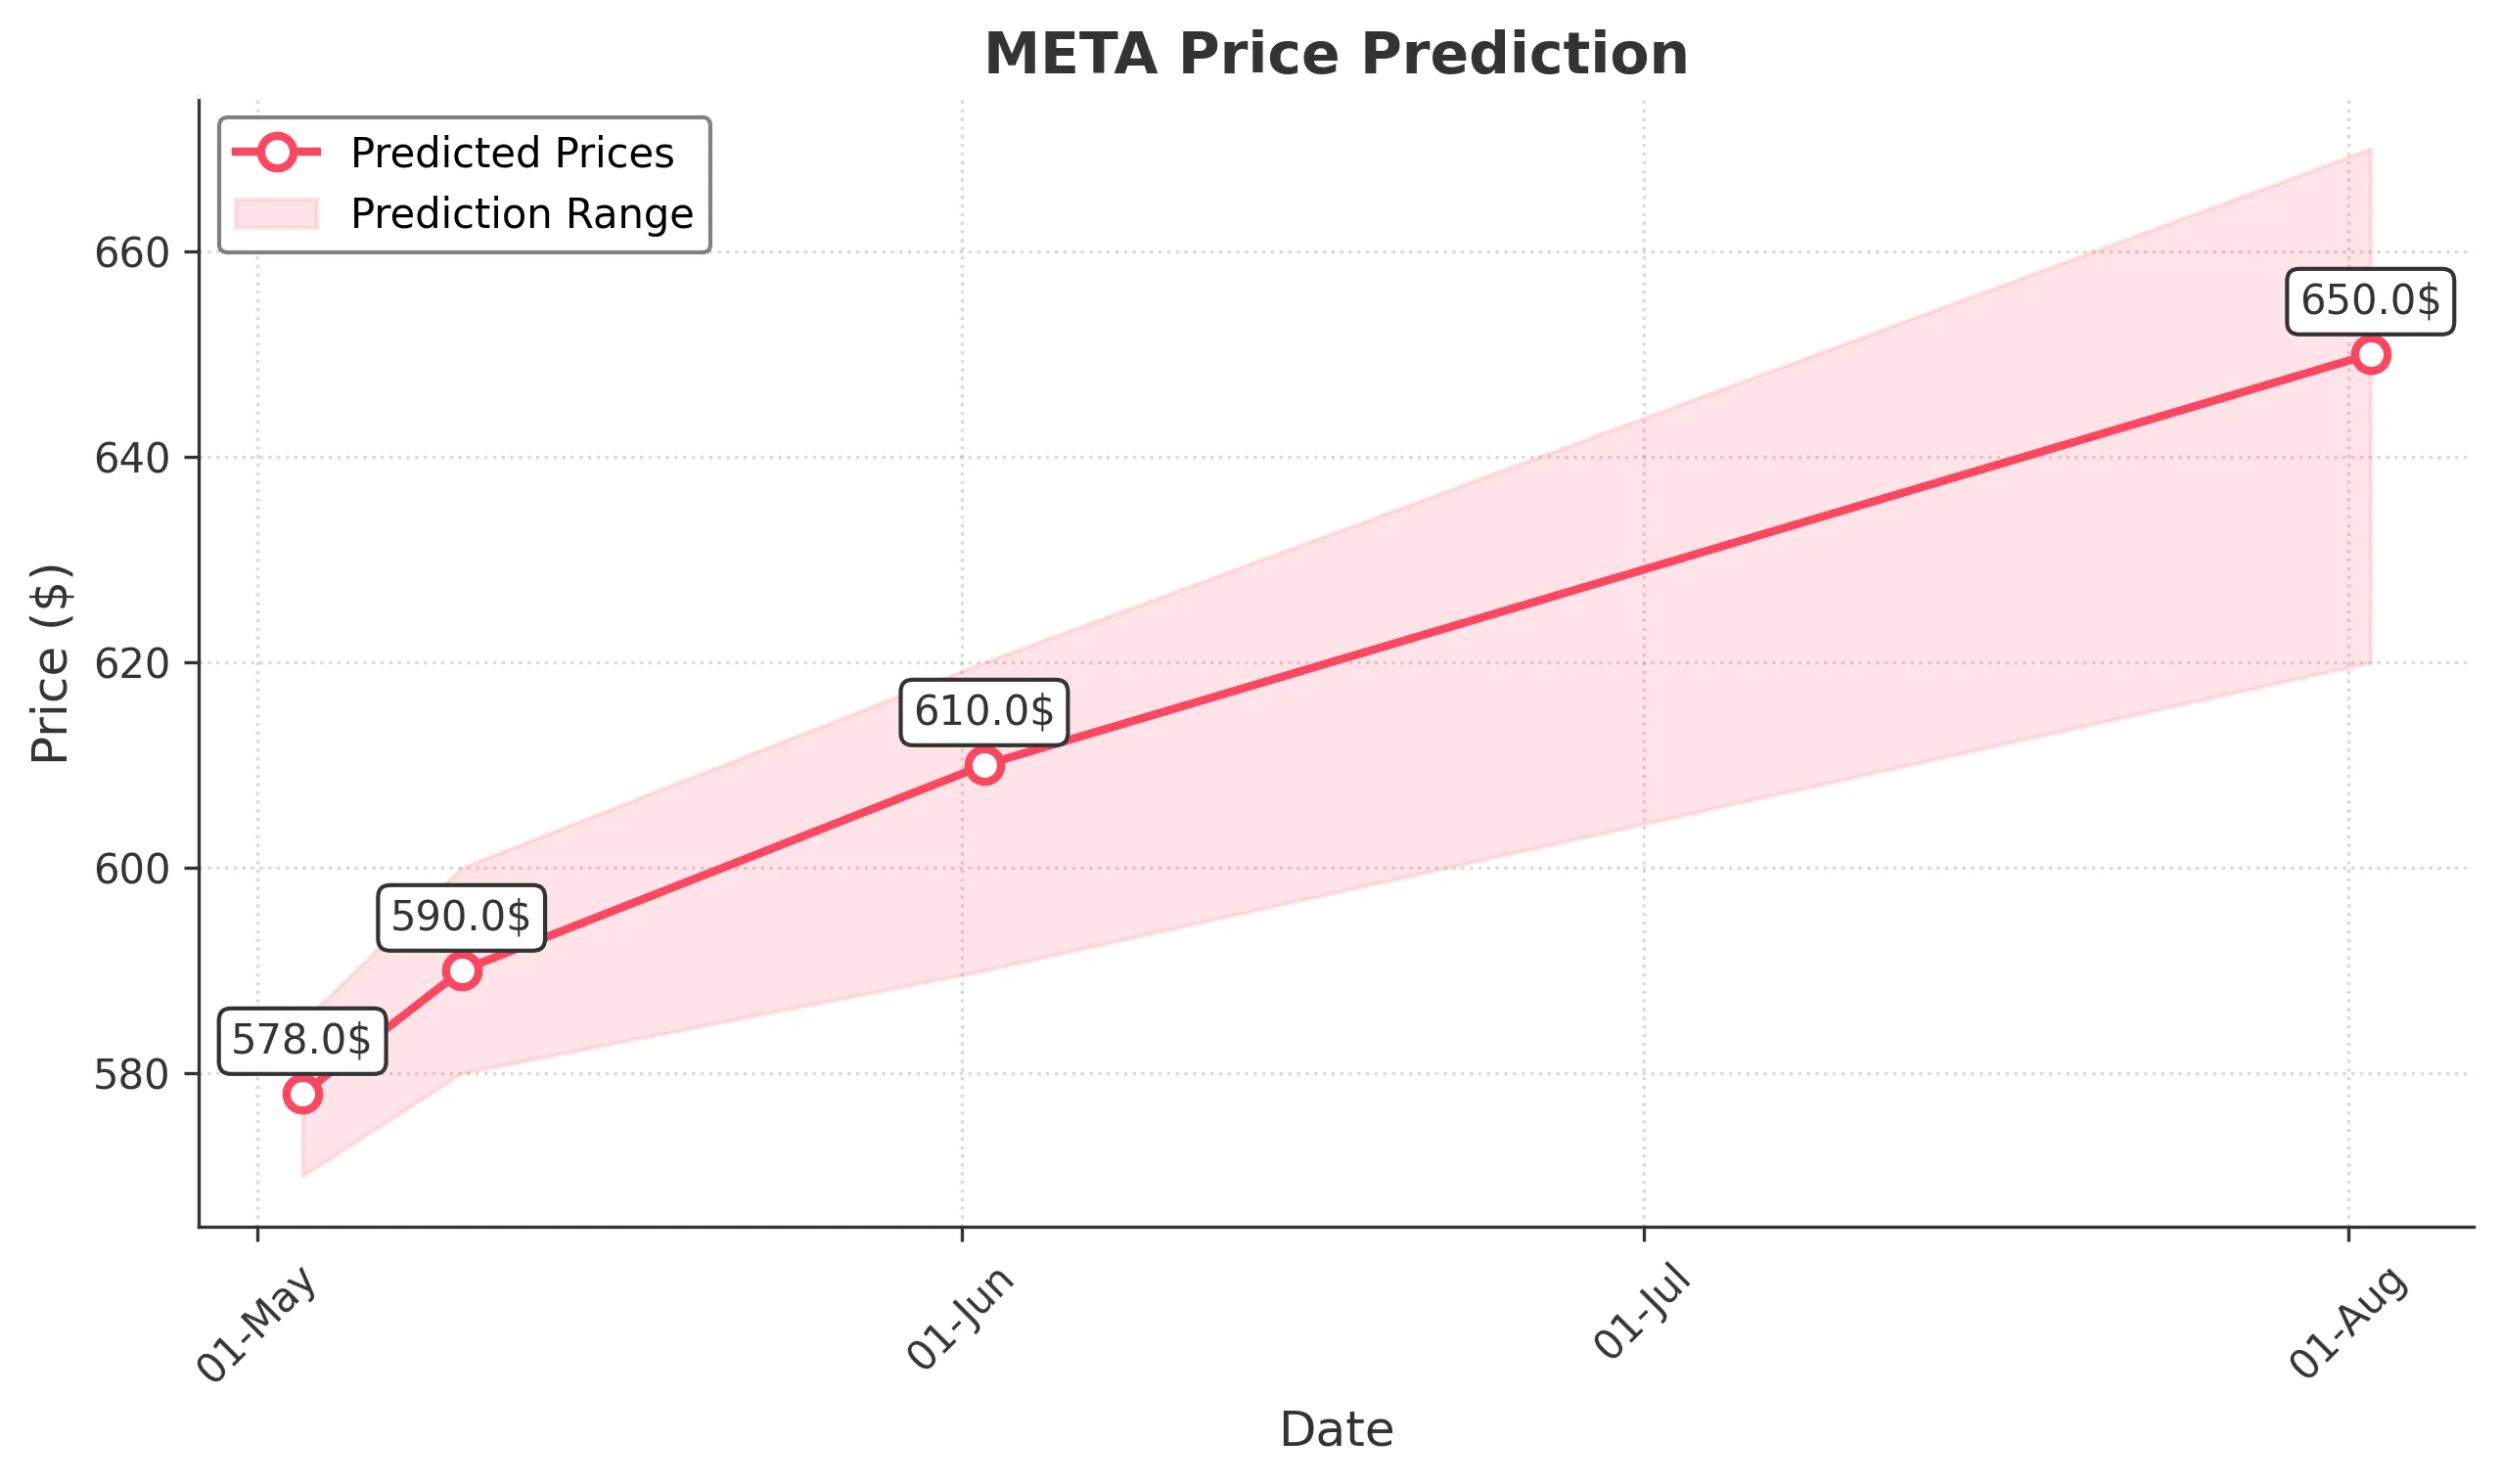
Target: May 3, 2025$578
$575
$585
$570
Description
The stock shows a slight bullish trend with a recent upward movement. RSI indicates a neutral position, while MACD suggests potential upward momentum. However, volatility remains high, and external market factors could influence price.
Analysis
Over the past 3 months, META has experienced significant fluctuations, with a bearish trend recently. Key support at 500 and resistance around 600. Technical indicators show mixed signals, with RSI fluctuating and MACD showing divergence. Volume spikes indicate increased interest, but overall sentiment remains cautious.
Confidence Level
Potential Risks
Market volatility and potential news could impact the prediction. A sudden downturn is possible if negative sentiment arises.
1 Week Prediction
Target: May 10, 2025$590
$585
$600
$580
Description
A potential recovery is indicated as the stock approaches key resistance levels. The recent candlestick patterns suggest bullish sentiment, but the market remains sensitive to macroeconomic news.
Analysis
The stock has shown a bearish trend recently, with significant support at 500. Technical indicators are mixed, with some signs of recovery. Volume analysis shows increased trading activity, suggesting potential interest from investors. However, external factors could lead to further declines.
Confidence Level
Potential Risks
Unforeseen macroeconomic events or earnings reports could lead to volatility. The bullish trend may reverse if resistance is not broken.
1 Month Prediction
Target: June 2, 2025$610
$600
$620
$590
Description
If the bullish trend continues, META could reach higher levels. The MACD shows potential for upward movement, and the RSI is approaching oversold territory, indicating a possible rebound.
Analysis
META has been volatile, with a recent bearish trend. Key support at 500 and resistance at 600. Technical indicators show mixed signals, with potential for recovery. Volume patterns indicate increased interest, but external factors could lead to further declines.
Confidence Level
Potential Risks
Market sentiment can shift quickly, and any negative news could reverse the trend. The stock's performance is highly dependent on broader market conditions.
3 Months Prediction
Target: August 2, 2025$650
$640
$670
$620
Description
If the current recovery trend continues, META could see significant gains. The technical indicators suggest a bullish reversal, but caution is advised due to potential market volatility.
Analysis
The stock has shown a bearish trend recently, with significant support at 500. Technical indicators are mixed, with some signs of recovery. Volume analysis shows increased trading activity, suggesting potential interest from investors. However, external factors could lead to further declines.
Confidence Level
Potential Risks
Long-term predictions are uncertain due to potential market shifts and economic conditions. A downturn could occur if negative sentiment prevails.