META Trading Predictions
1 Day Prediction
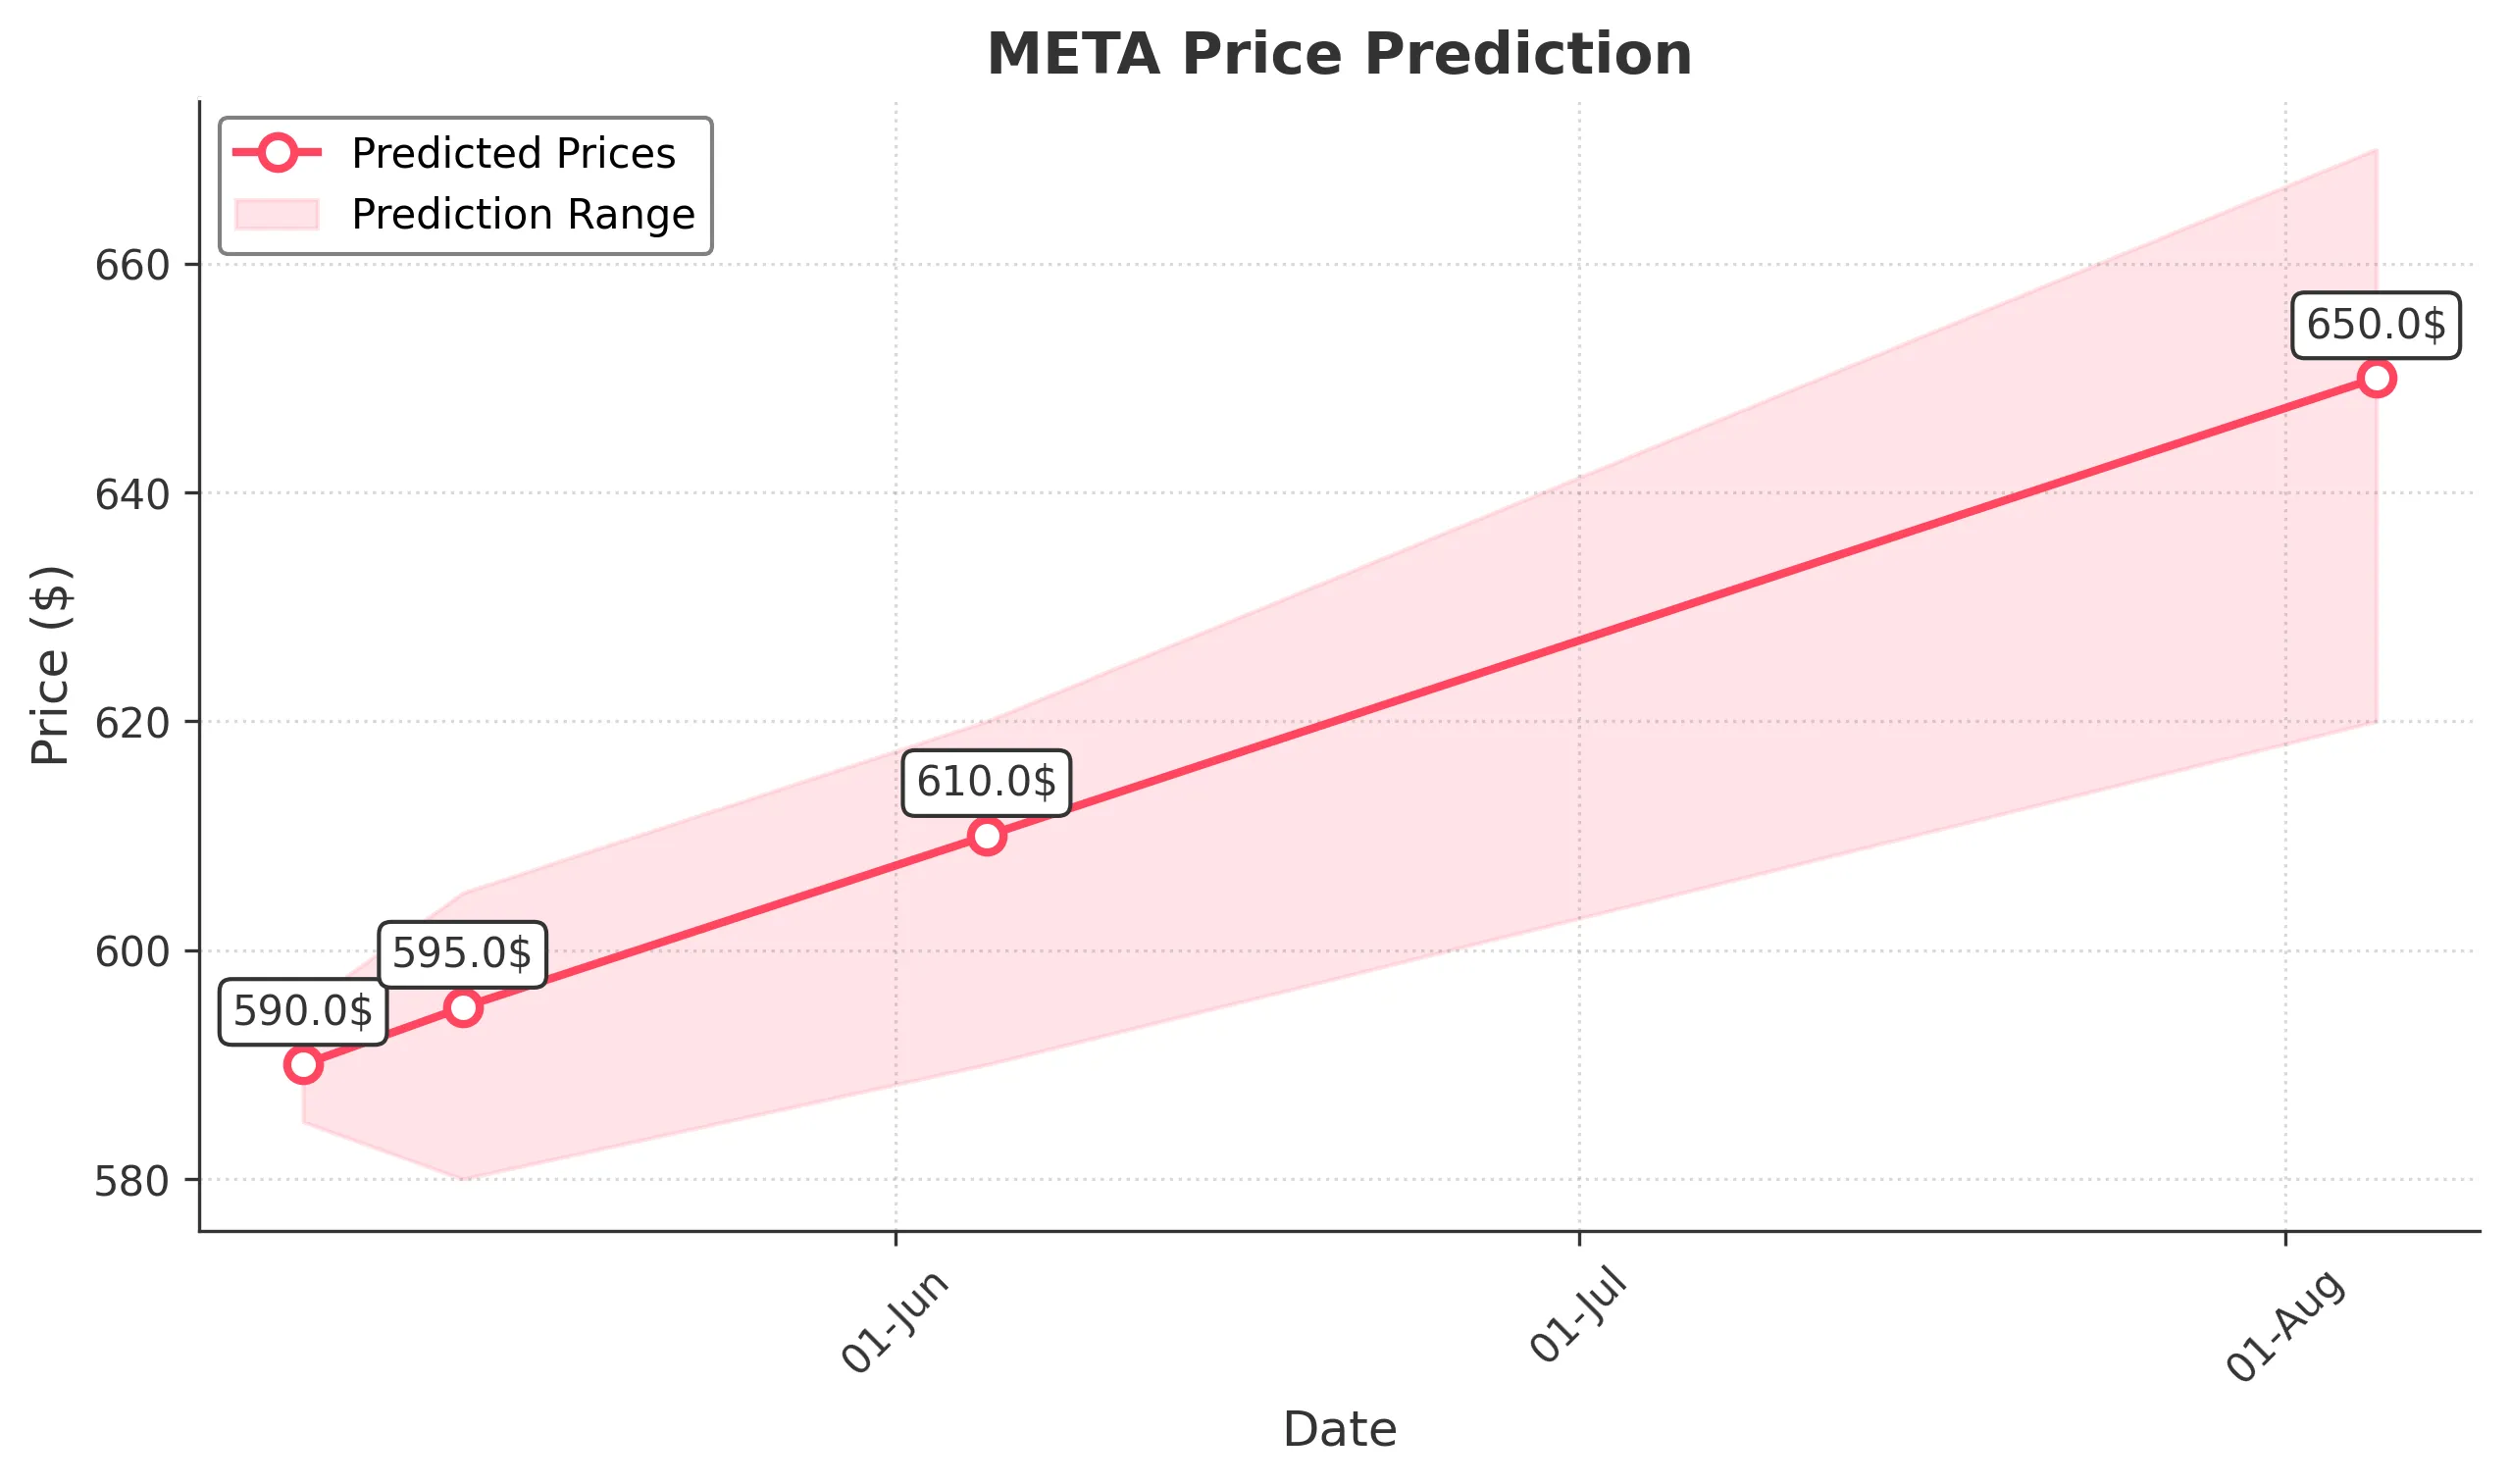
Target: May 6, 2025$590
$590
$595
$585
Description
The stock shows a slight bearish trend with recent lower highs and lows. RSI indicates oversold conditions, suggesting a potential bounce. However, MACD is bearish, indicating continued downward pressure. Volume remains low, indicating lack of strong buying interest.
Analysis
Over the past 3 months, META has experienced significant volatility, with a bearish trend evident in the last month. Key support at 580.00 and resistance at 600.00. Technical indicators show mixed signals, with RSI indicating oversold conditions but MACD remaining bearish.
Confidence Level
Potential Risks
Market volatility and external news could impact the prediction. A sudden positive catalyst could reverse the trend.
1 Week Prediction
Target: May 13, 2025$595
$590
$605
$580
Description
A potential short-term recovery is expected as the stock approaches key support levels. The RSI may recover from oversold conditions, and a bullish divergence could form. However, MACD remains bearish, indicating caution.
Analysis
The stock has shown a bearish trend with significant volume spikes during sell-offs. Support at 580.00 is critical, while resistance at 600.00 may cap any upward movement. Technical indicators suggest a potential short-term recovery, but overall sentiment remains cautious.
Confidence Level
Potential Risks
Uncertainty in market sentiment and potential macroeconomic events could lead to unexpected price movements.
1 Month Prediction
Target: June 5, 2025$610
$600
$620
$590
Description
A gradual recovery is anticipated as the stock stabilizes near support levels. Positive market sentiment and potential bullish patterns may emerge. However, macroeconomic factors could still pose risks.
Analysis
The stock has been in a bearish phase, but signs of stabilization are emerging. Key support at 580.00 and resistance at 620.00. Technical indicators show potential for recovery, but overall market sentiment remains mixed, with external factors influencing price action.
Confidence Level
Potential Risks
Market volatility and external economic factors could hinder recovery. A lack of strong buying interest may limit upward movement.
3 Months Prediction
Target: August 5, 2025$650
$640
$670
$620
Description
Long-term recovery is expected as the stock finds support and market sentiment improves. Positive earnings reports and macroeconomic stability could drive prices higher. However, caution is advised due to potential market corrections.
Analysis
The stock has shown significant volatility, with a bearish trend recently. However, potential for recovery exists if support levels hold. Key resistance at 670.00 and support at 620.00. Technical indicators suggest a possible bullish reversal, but external factors could impact performance.
Confidence Level
Potential Risks
Unforeseen macroeconomic events or negative news could derail the recovery. Market sentiment remains a key factor.