META Trading Predictions
1 Day Prediction
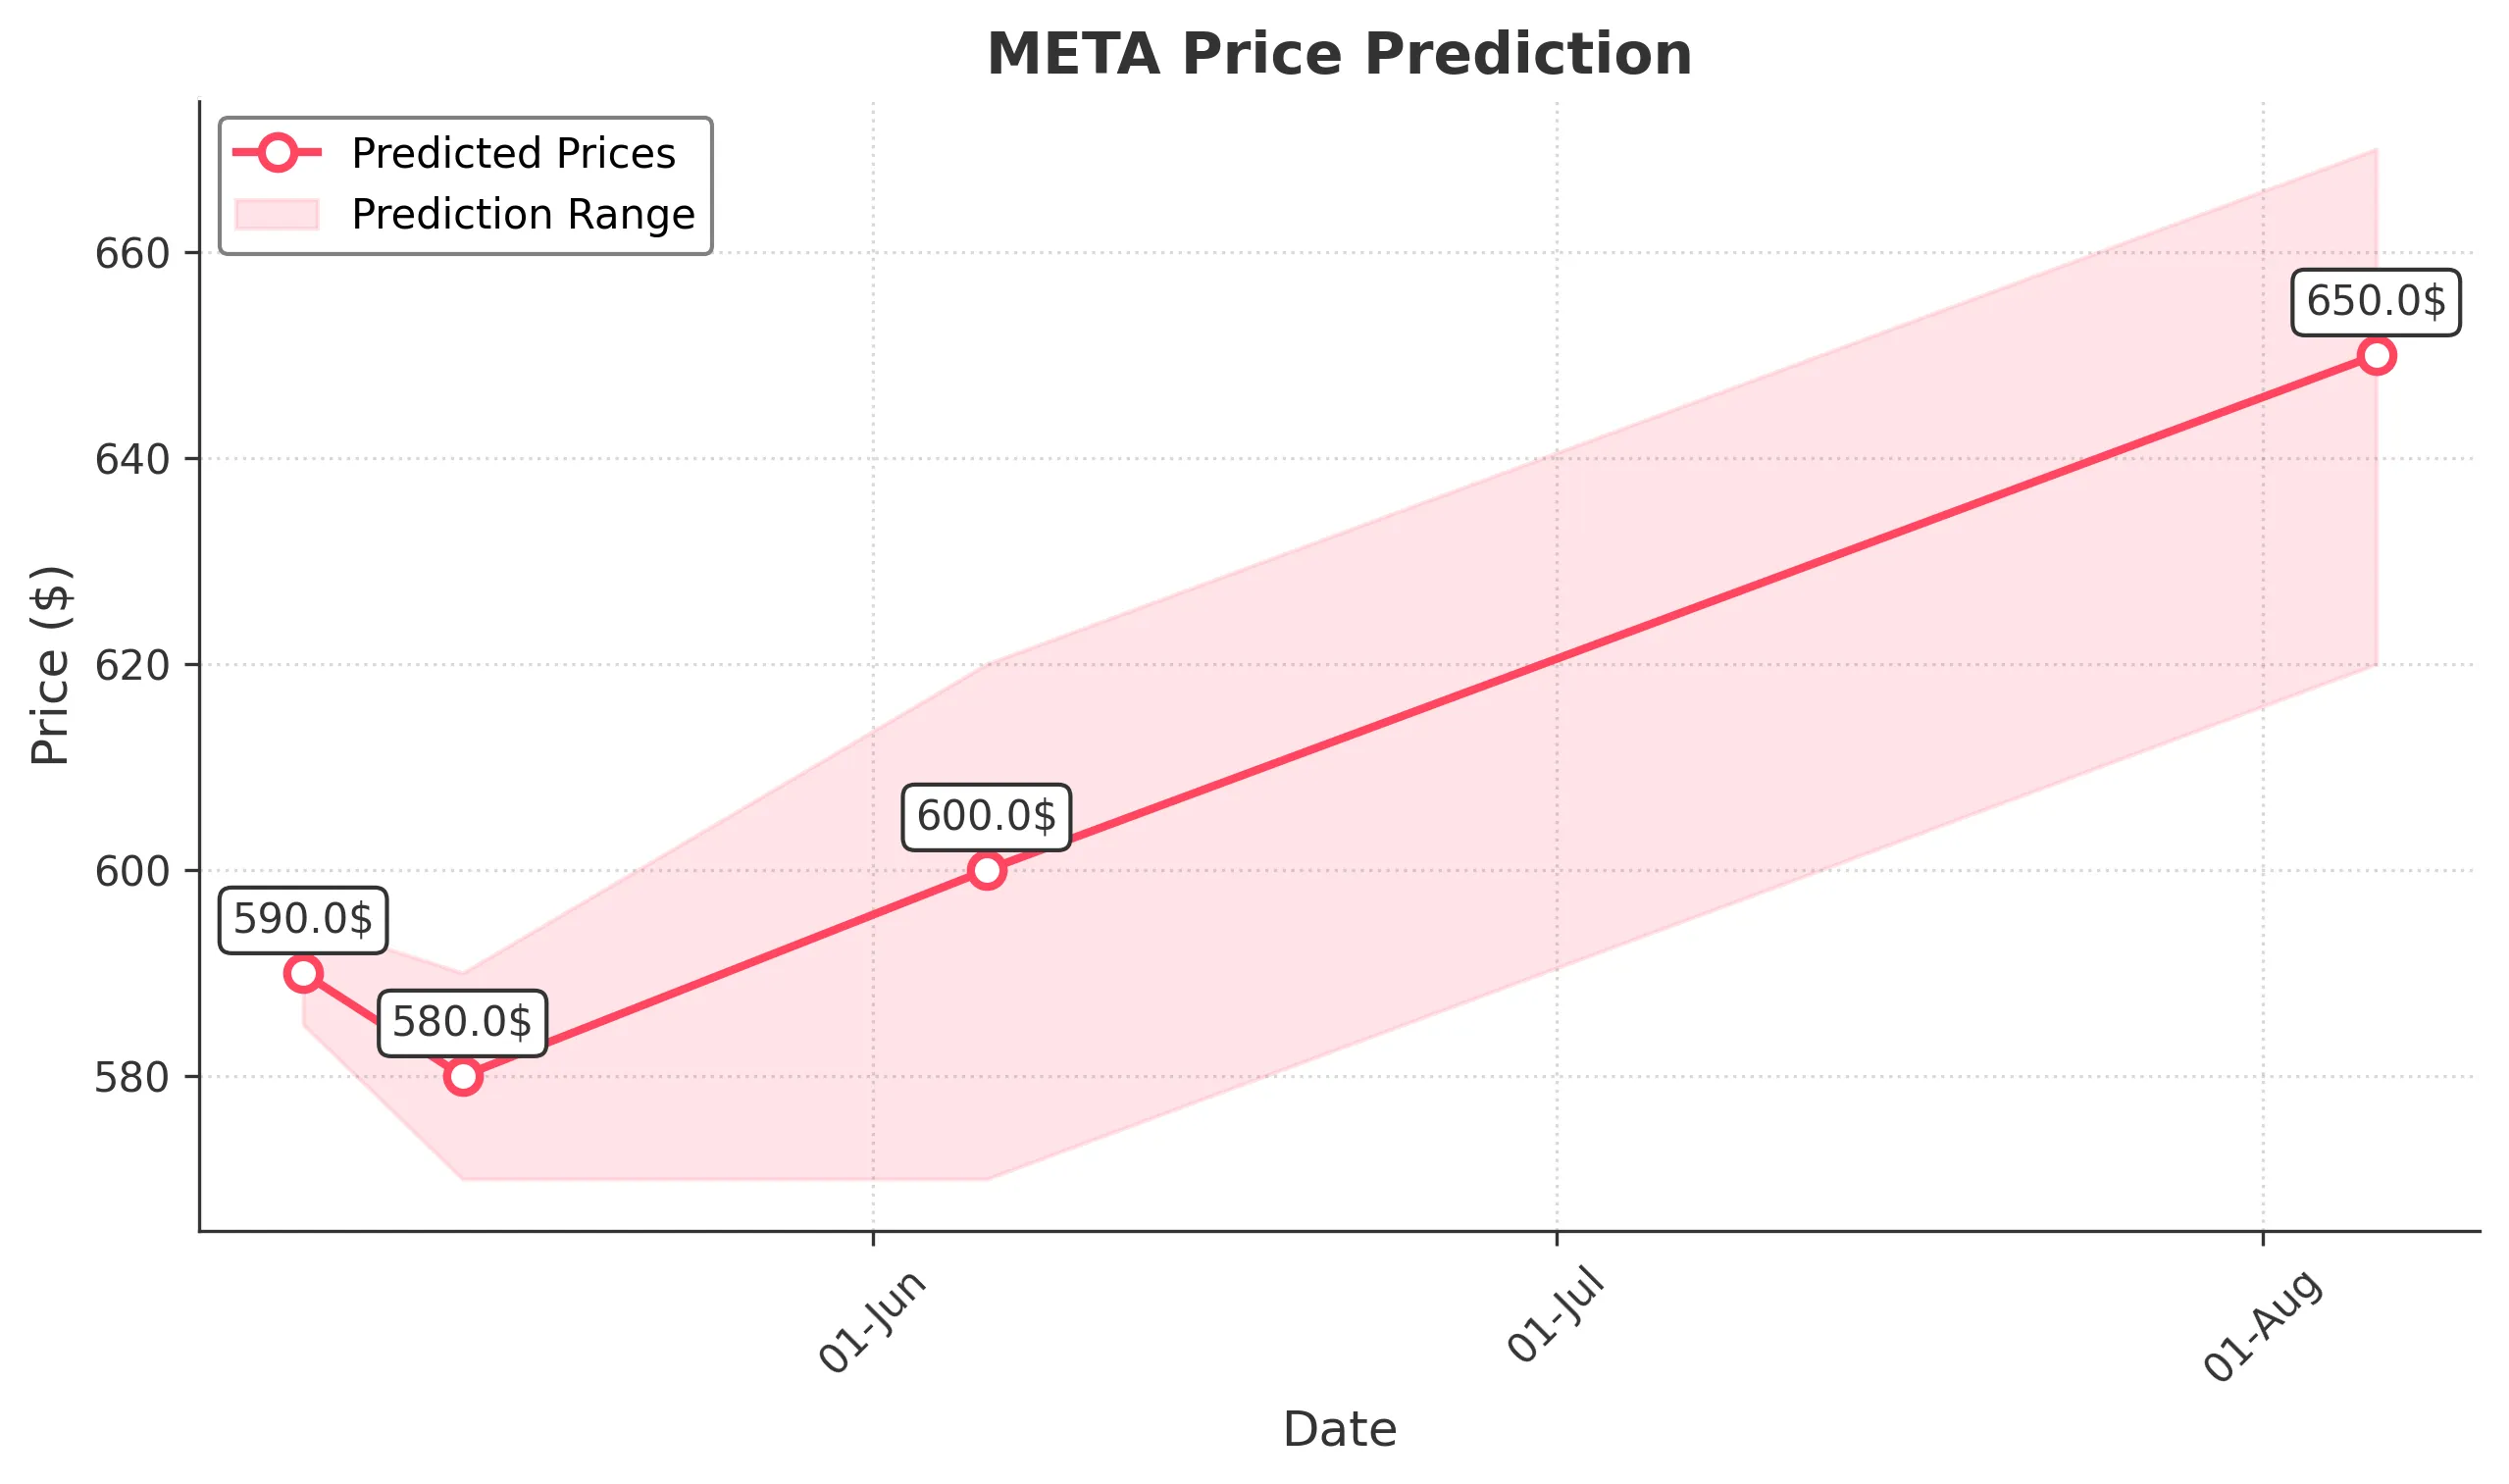
Target: May 7, 2025$590
$591
$595
$585
Description
The stock shows a slight bearish trend with recent lower highs and lows. RSI indicates oversold conditions, suggesting a potential bounce. However, MACD is bearish, indicating continued downward pressure. Volume remains moderate, reflecting cautious sentiment.
Analysis
Over the past 3 months, META has experienced significant volatility, with a bearish trend evident in the last month. Key support at 580 and resistance at 600. Technical indicators show mixed signals, with RSI nearing oversold levels but MACD indicating bearish momentum. Volume spikes on down days suggest selling pressure.
Confidence Level
Potential Risks
Market volatility and external news could impact the prediction. A sudden positive catalyst could reverse the trend.
1 Week Prediction
Target: May 14, 2025$580
$585
$590
$570
Description
The bearish trend is expected to continue, with potential for a slight recovery. The stock is testing support levels around 580. If it holds, a rebound could occur, but MACD remains negative, indicating ongoing selling pressure.
Analysis
META's performance has been characterized by a downward trend, with significant resistance at 600. The stock has tested support levels multiple times, and while there are signs of potential recovery, the overall sentiment remains bearish. Volume analysis shows increased selling activity.
Confidence Level
Potential Risks
Unforeseen market events or earnings reports could lead to volatility. A break below 580 could trigger further declines.
1 Month Prediction
Target: June 6, 2025$600
$590
$620
$570
Description
A potential recovery is anticipated as the stock approaches key support levels. If it can break above 600, bullish momentum may build. However, MACD and RSI suggest caution as the market sentiment remains mixed.
Analysis
The past three months have shown a bearish trend, with significant volatility. Key support at 580 and resistance at 600 are critical levels. Technical indicators suggest a potential reversal, but overall market sentiment remains cautious, with mixed signals from volume and momentum indicators.
Confidence Level
Potential Risks
Market conditions and macroeconomic factors could significantly impact the stock's performance. A failure to break resistance at 600 could lead to further declines.
3 Months Prediction
Target: August 6, 2025$650
$640
$670
$620
Description
If the stock can stabilize and break through resistance at 600, a bullish trend may develop. Positive macroeconomic indicators and improved market sentiment could support this recovery. However, caution is warranted as volatility remains high.
Analysis
META's performance has been volatile, with a clear bearish trend in recent months. Key resistance at 600 and support at 580 are critical. While there are signs of potential recovery, the overall market sentiment remains uncertain, influenced by macroeconomic factors and trading volume patterns.
Confidence Level
Potential Risks
Economic conditions, interest rates, and market sentiment could lead to unexpected volatility. A failure to maintain upward momentum could result in a return to bearish trends.