META Trading Predictions
1 Day Prediction
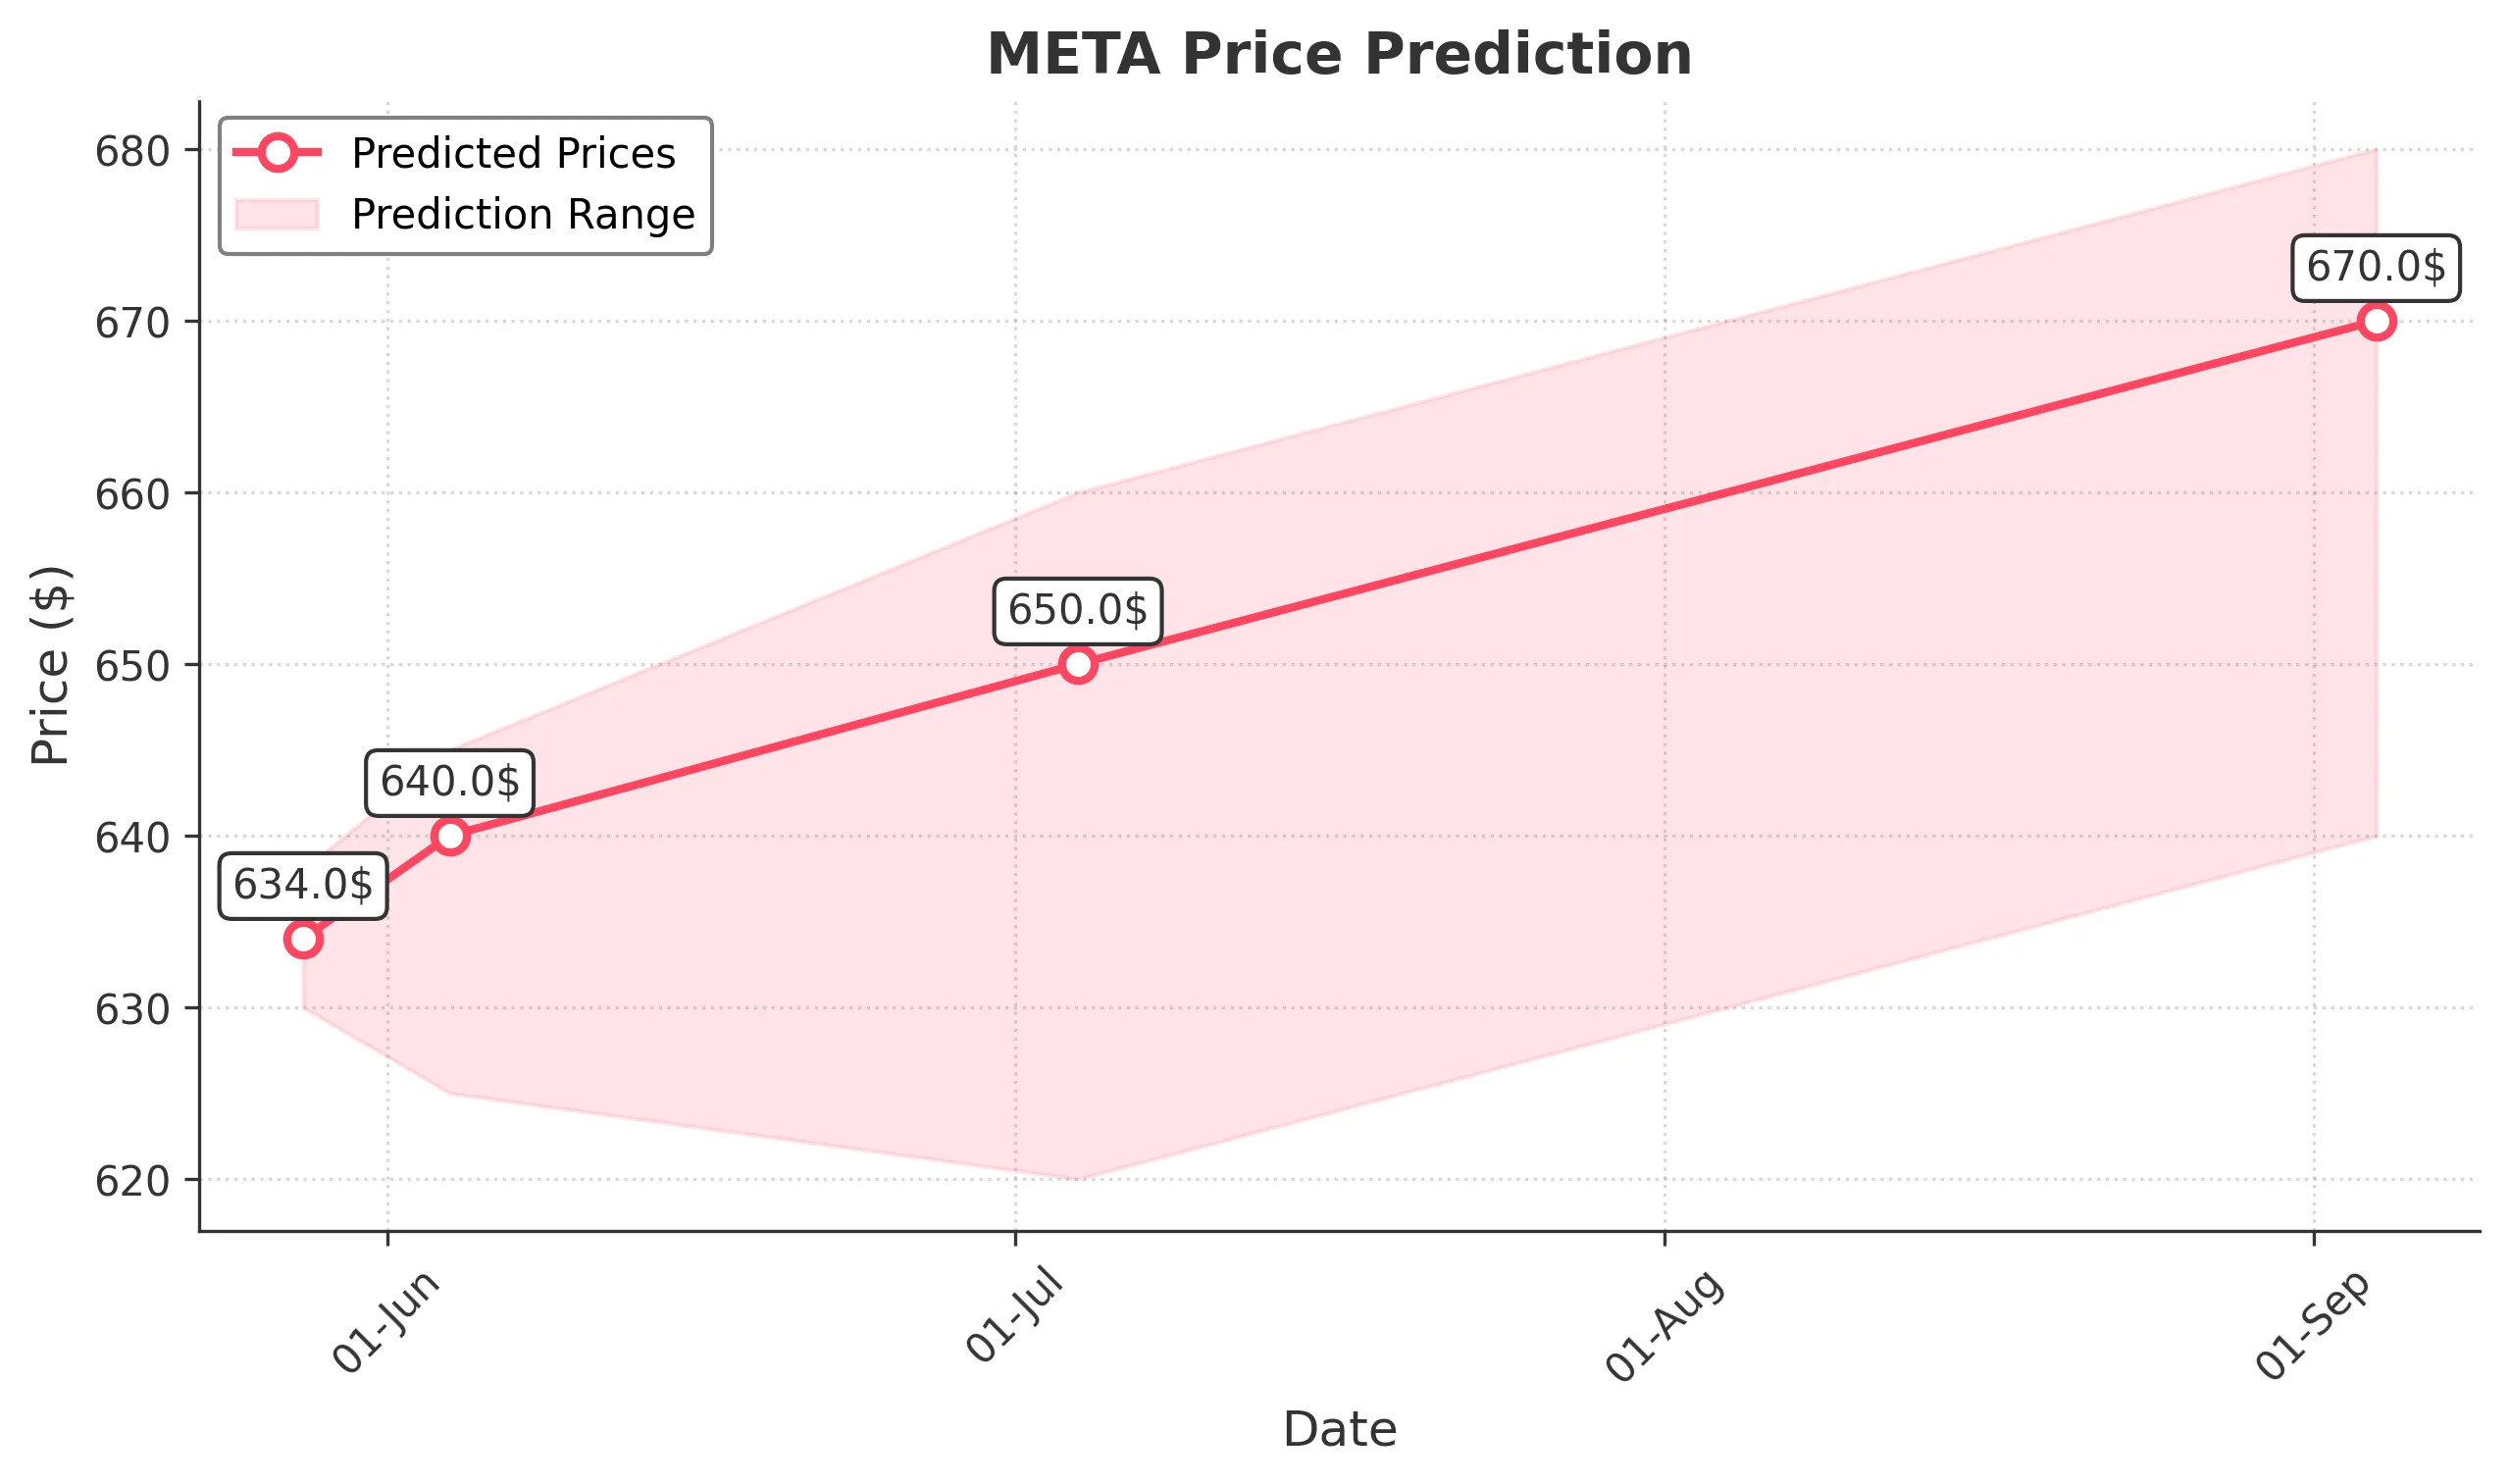
Target: May 28, 2025$634
$632
$638
$630
Description
The stock shows a slight bullish trend with a recent Doji candlestick indicating indecision. RSI is neutral, and MACD is close to crossing above the signal line, suggesting potential upward momentum. However, recent volatility may limit gains.
Analysis
Over the past 3 months, META has experienced significant volatility, with a bearish trend recently. Key support at 600 and resistance at 650. Moving averages indicate a potential reversal, but the overall sentiment remains cautious due to macroeconomic factors.
Confidence Level
Potential Risks
Market sentiment could shift due to external news or earnings reports, which may impact the stock's performance.
1 Week Prediction
Target: June 4, 2025$640
$634
$645
$625
Description
A bullish reversal pattern is forming, supported by a recent increase in volume. The MACD shows a bullish crossover, and the RSI is approaching overbought territory. However, resistance at 650 may pose a challenge.
Analysis
The stock has shown signs of recovery after a bearish phase, with key support at 600. The recent increase in volume indicates renewed interest, but external factors could influence the stock's trajectory.
Confidence Level
Potential Risks
Potential market corrections or negative news could reverse the upward trend, impacting the forecast.
1 Month Prediction
Target: July 4, 2025$650
$640
$660
$620
Description
The stock is expected to continue its upward trend, supported by bullish technical indicators. The Fibonacci retracement level at 650 is a key target, but market volatility could lead to fluctuations.
Analysis
META has shown a recovery trend, with significant support at 600 and resistance at 650. The stock's performance is influenced by broader market conditions and investor sentiment, which remains cautious.
Confidence Level
Potential Risks
Economic data releases and earnings reports could introduce volatility, affecting the stock's performance.
3 Months Prediction
Target: September 4, 2025$670
$655
$680
$640
Description
Long-term indicators suggest a bullish trend, with potential for further gains as the stock breaks through resistance levels. However, macroeconomic uncertainties could impact growth.
Analysis
The stock has shown resilience, with a potential bullish trend forming. Key support at 600 and resistance at 650-670. Market sentiment is mixed, and external factors could influence future performance.
Confidence Level
Potential Risks
Unforeseen market events or economic downturns could lead to a reversal in the stock's upward trajectory.