META Trading Predictions
1 Day Prediction
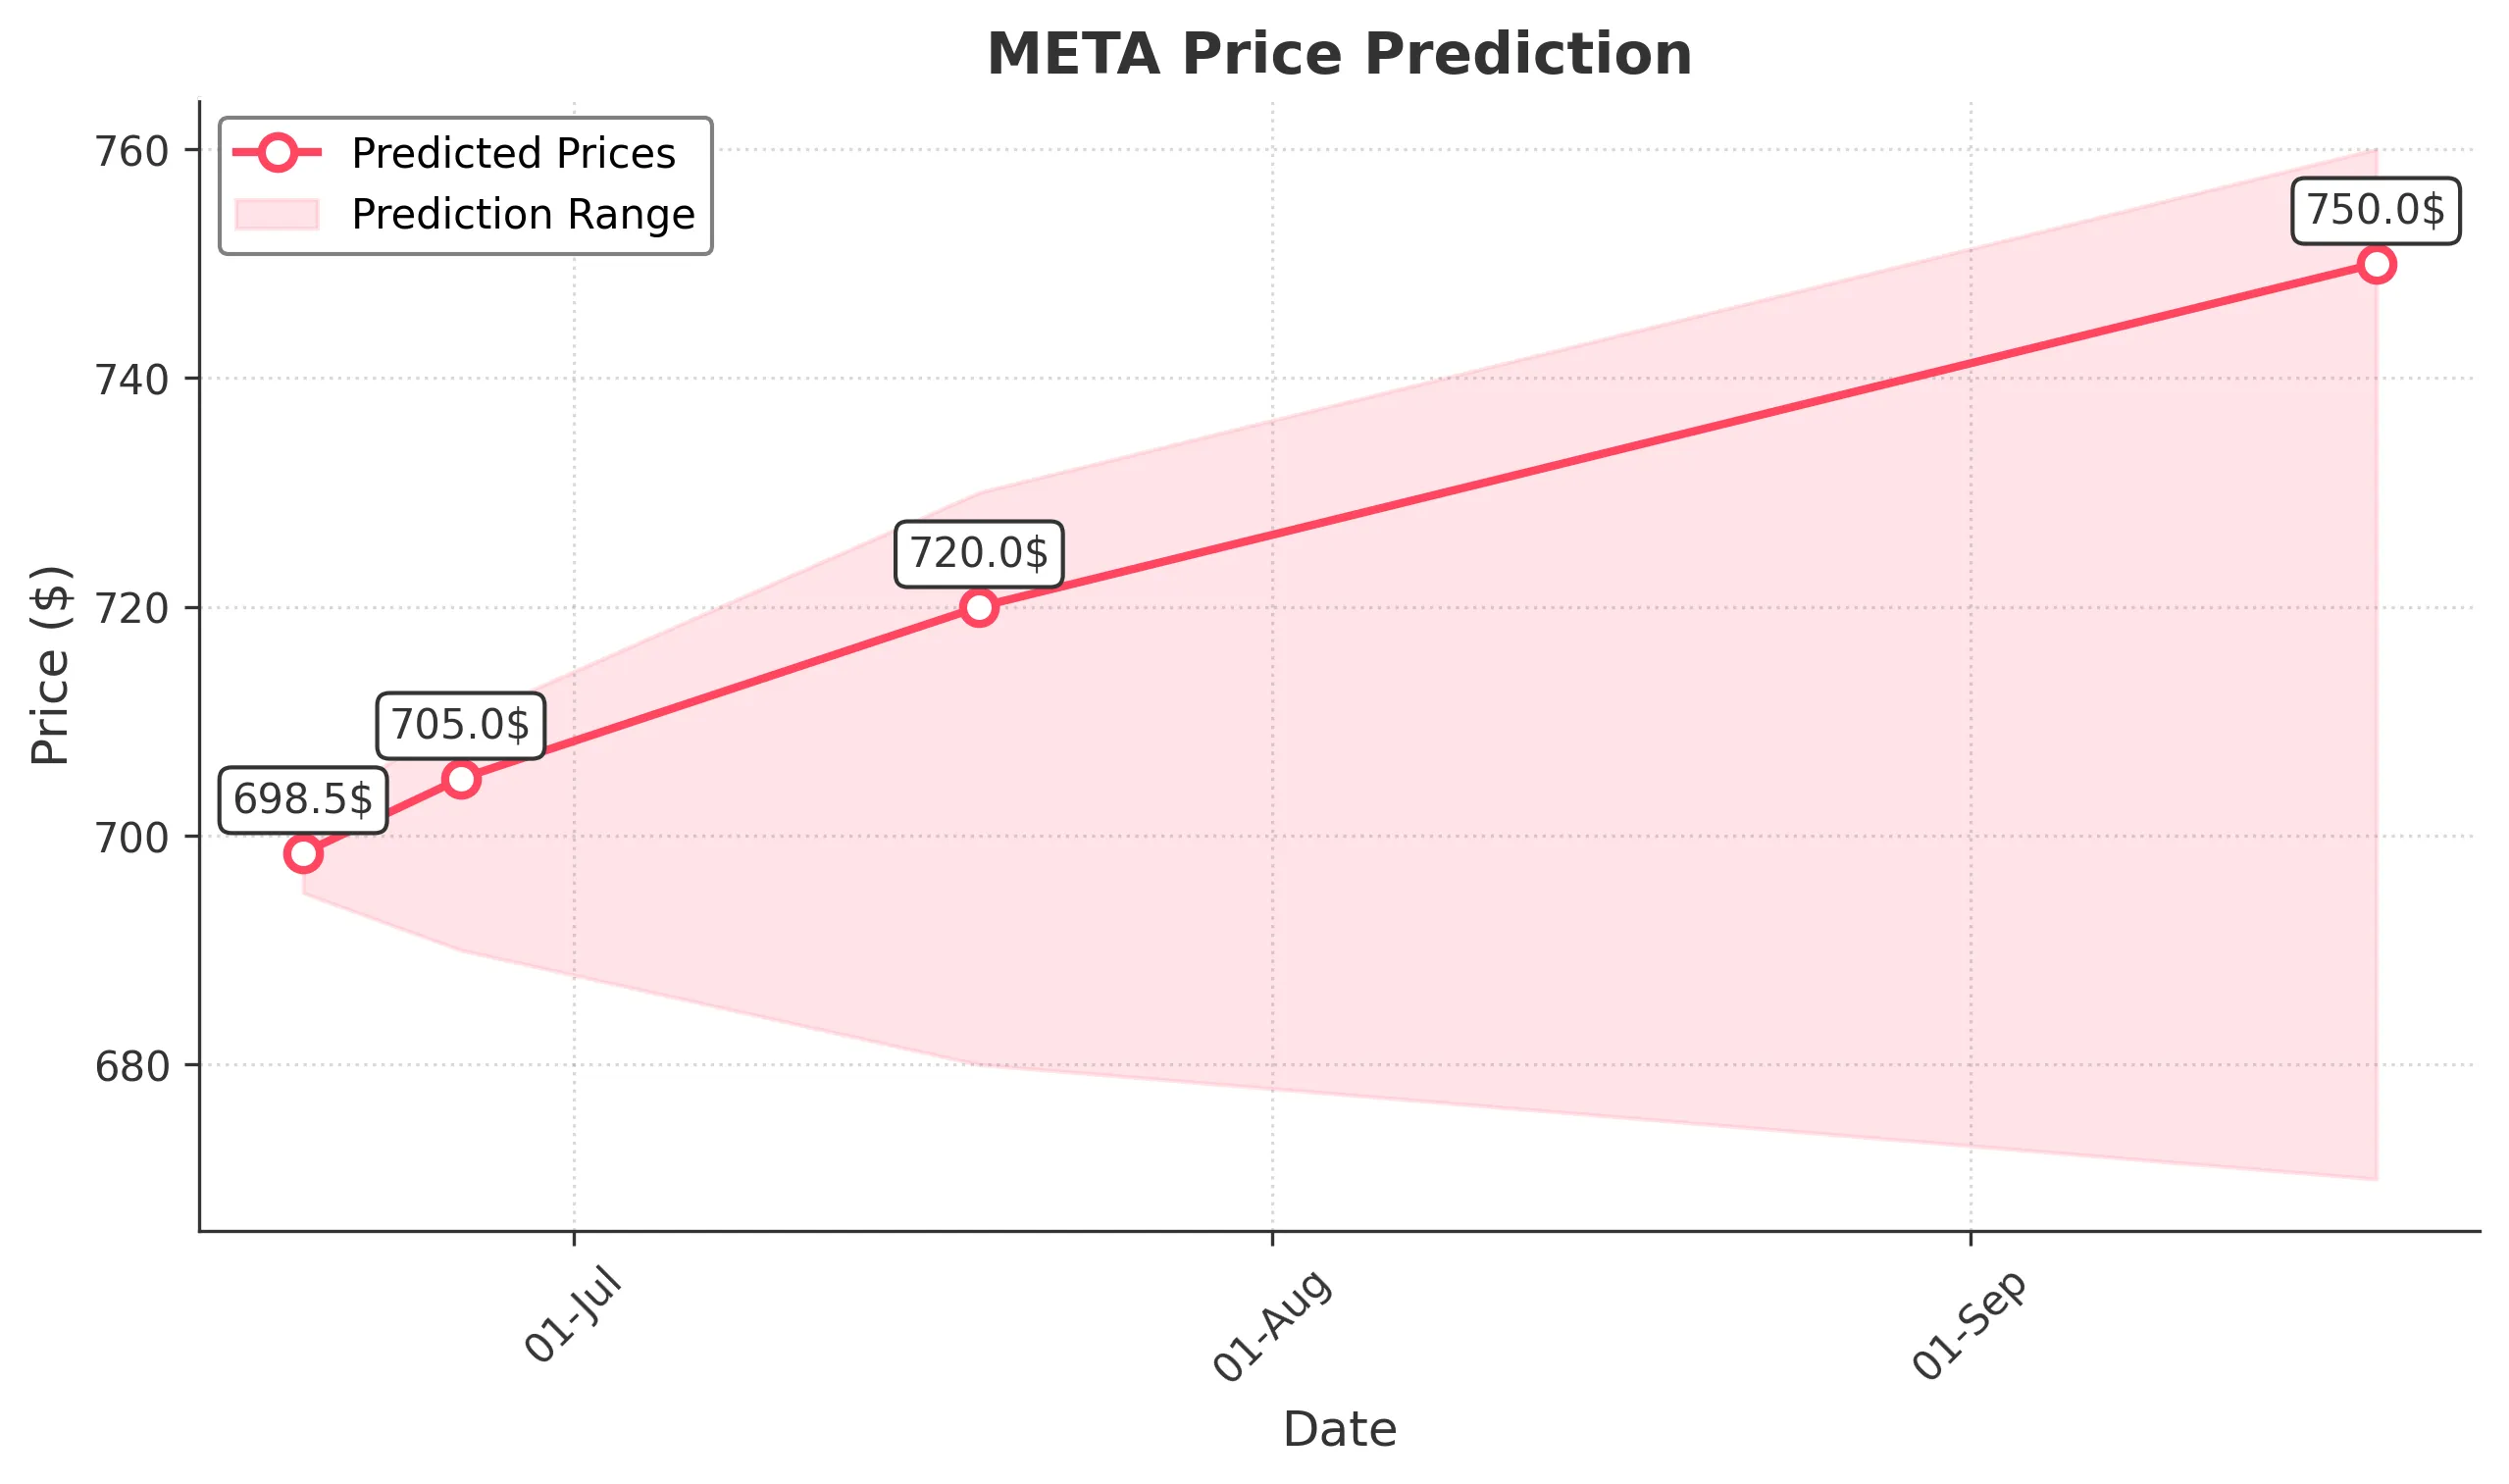
Target: June 19, 2025$698.5
$697.5
$702
$695
Description
The stock shows a slight bullish trend with a recent Doji candlestick indicating indecision. The RSI is near 50, suggesting a potential upward move. However, MACD is flattening, indicating possible consolidation.
Analysis
Over the past 3 months, META has shown a bullish trend with significant upward movements, reaching highs around 700. Key support is at 695, while resistance is at 705. Volume has been consistent, but recent spikes indicate potential profit-taking.
Confidence Level
Potential Risks
Market volatility and external news could impact the price. A bearish reversal is possible if the support at 695 breaks.
1 Week Prediction
Target: June 26, 2025$705
$698
$710
$690
Description
The stock is expected to continue its upward trajectory, supported by a bullish MACD crossover. The RSI is approaching overbought territory, indicating potential for a pullback. Watch for volume spikes as a sign of strength.
Analysis
META has been on a bullish run, with strong support at 695 and resistance at 710. The recent price action shows a series of higher lows, indicating a strong uptrend. However, the RSI nearing overbought levels suggests caution.
Confidence Level
Potential Risks
If the market sentiment shifts negatively, it could lead to a quick reversal. Watch for external economic news that may impact tech stocks.
1 Month Prediction
Target: July 19, 2025$720
$705
$730
$680
Description
The bullish trend is expected to continue, with Fibonacci retracement levels indicating potential resistance at 730. The MACD remains positive, and the RSI is expected to stabilize after a brief pullback.
Analysis
META's performance has been strong, with a clear bullish trend. Key support is at 680, while resistance is at 730. The stock has shown resilience, but external factors could introduce volatility.
Confidence Level
Potential Risks
Potential market corrections and economic data releases could impact the stock's performance. A break below 680 would signal a bearish trend.
3 Months Prediction
Target: September 19, 2025$750
$720
$760
$670
Description
Long-term bullish sentiment is supported by strong fundamentals and positive market sentiment. The stock is expected to test the 760 resistance level, with potential for a breakout if momentum continues.
Analysis
META has shown a strong upward trend over the past three months, with key support at 670 and resistance at 760. The stock's performance is influenced by broader market trends and economic indicators, which could introduce volatility.
Confidence Level
Potential Risks
Economic downturns or negative news could lead to significant corrections. Watch for changes in market sentiment that could affect tech stocks.