META Trading Predictions
1 Day Prediction
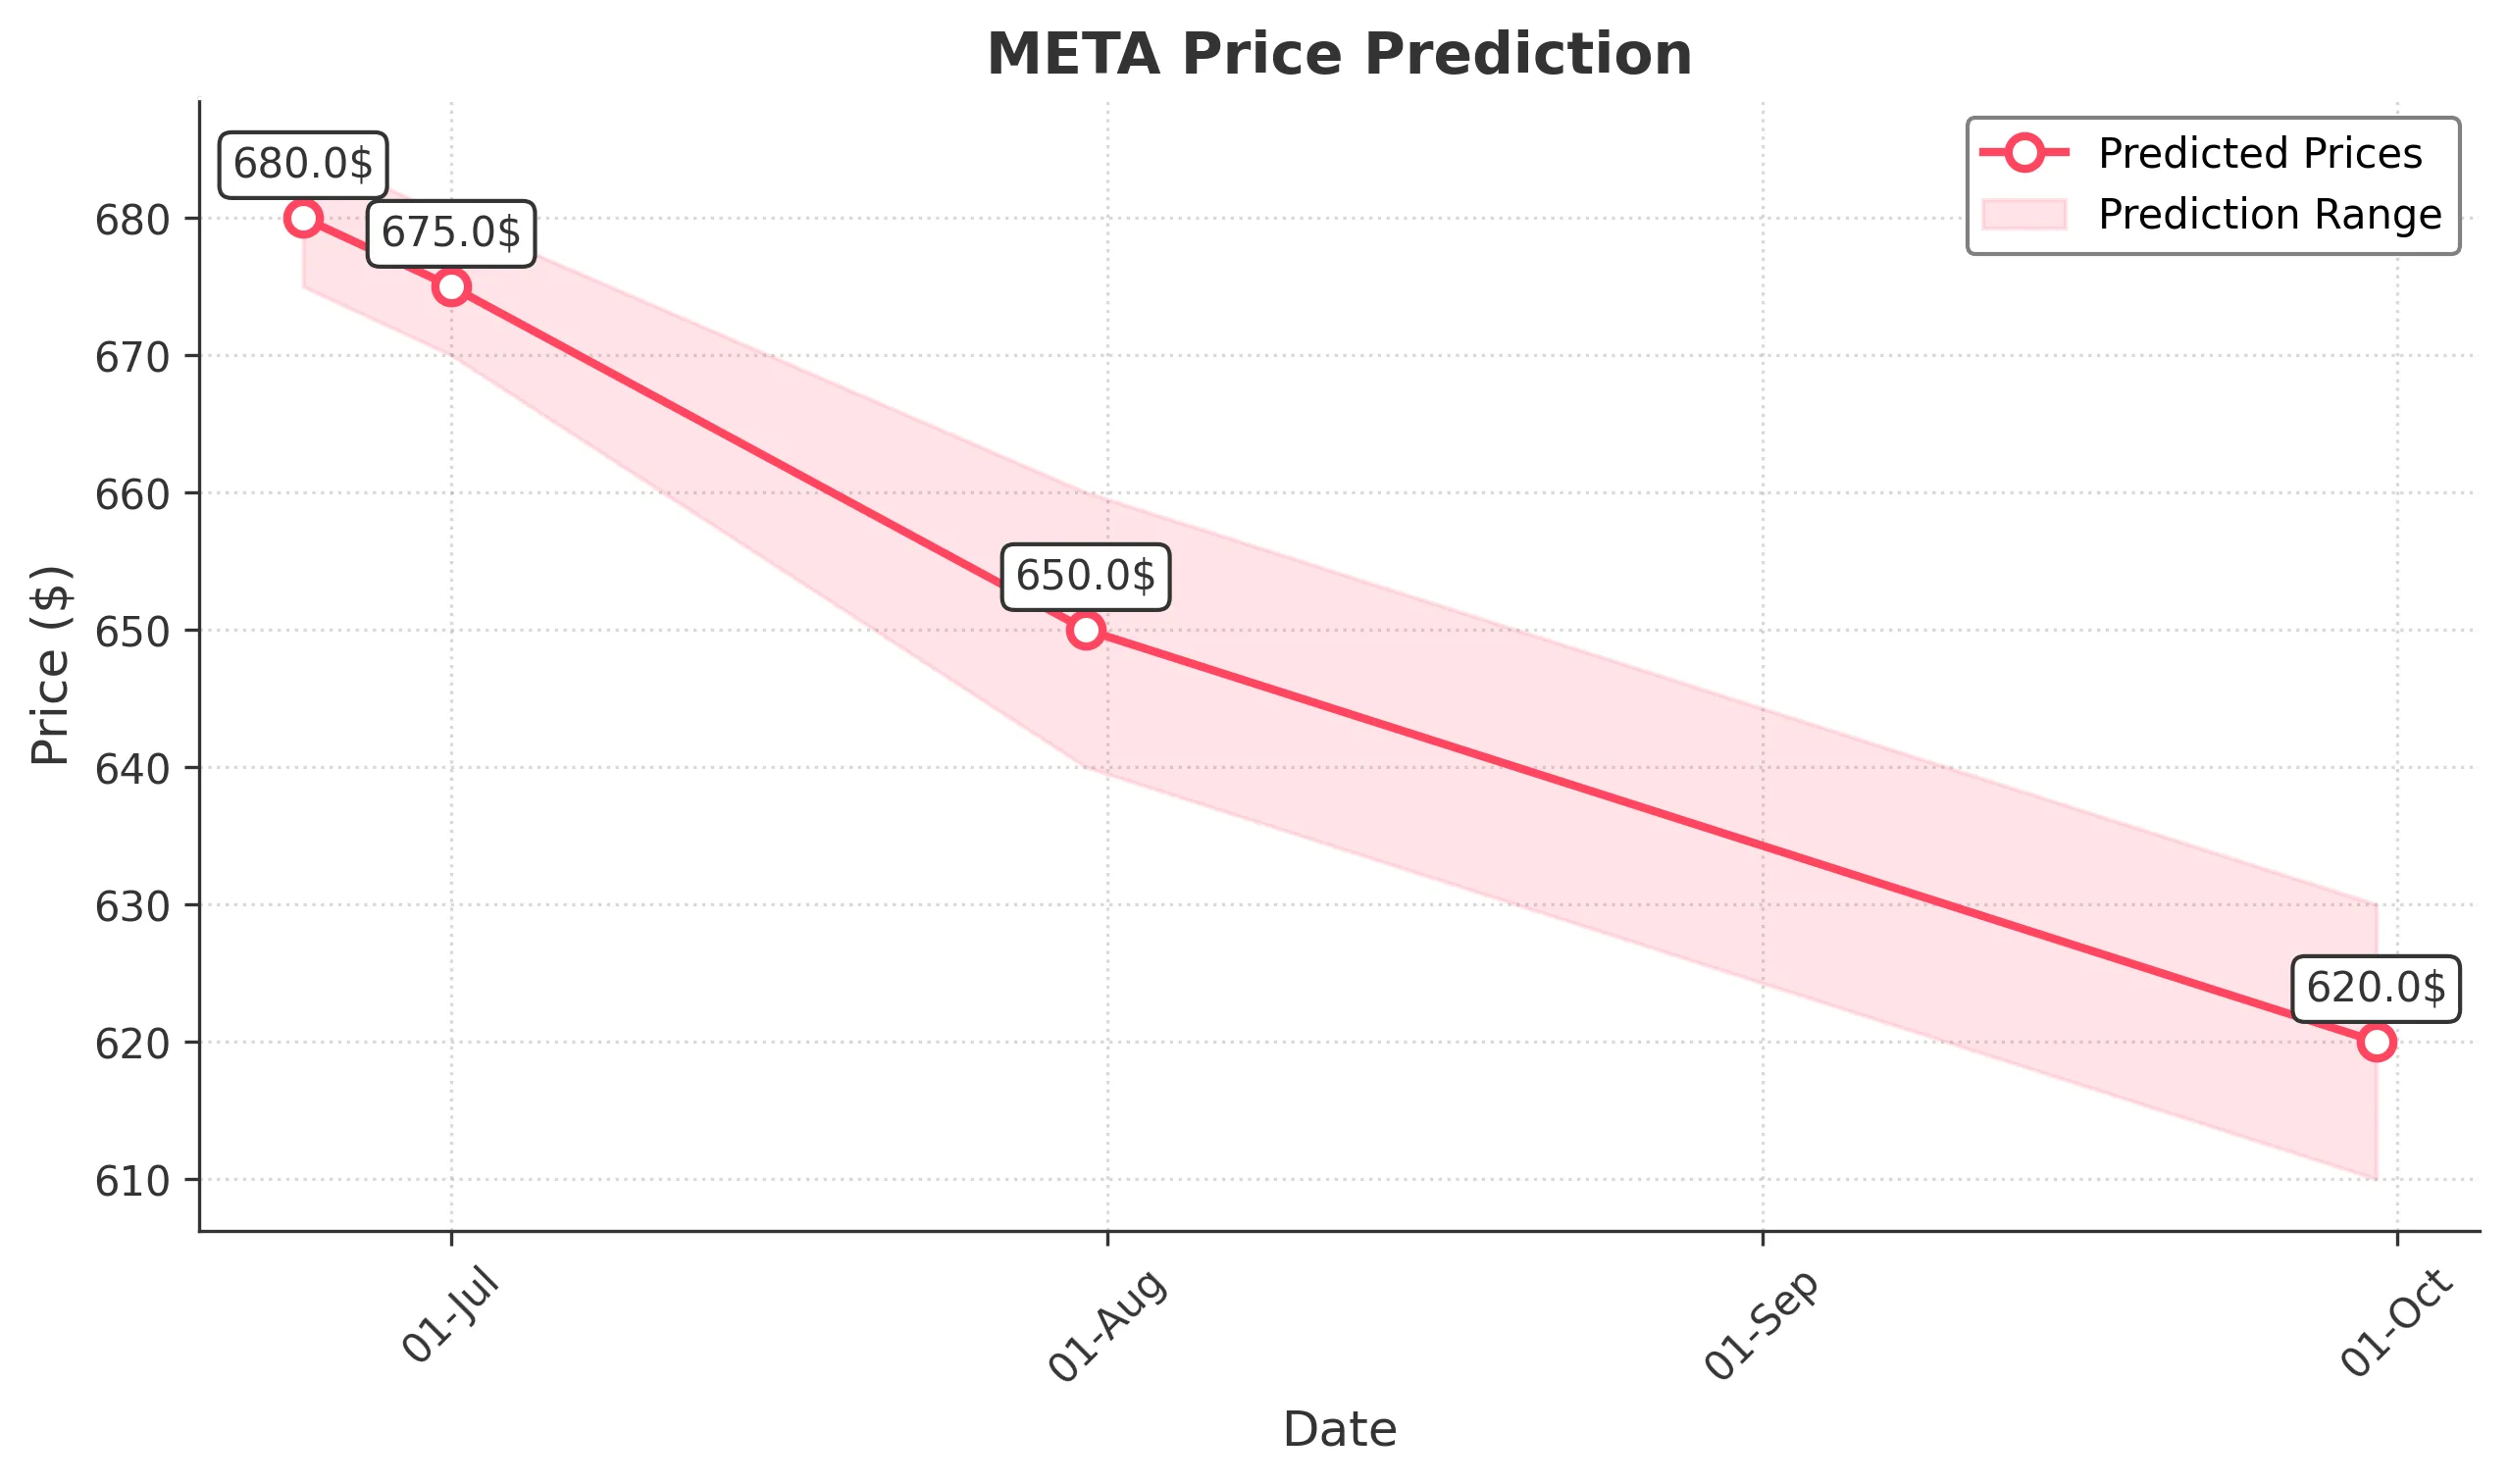
Target: June 24, 2025$680
$681.9
$685
$675
Description
The stock shows a slight bearish trend with recent lower highs. RSI indicates overbought conditions, suggesting a potential pullback. Volume has decreased, indicating weakening momentum. Expect a close around 680.
Analysis
Over the past 3 months, META has shown a bullish trend with significant price increases, but recent price action indicates a potential reversal. Key support at 675 and resistance at 700. Volume patterns suggest decreasing interest.
Confidence Level
Potential Risks
Market volatility and external news could impact the price significantly.
1 Week Prediction
Target: July 1, 2025$675
$680
$680
$670
Description
Expect a continued downward trend as the stock faces resistance at 685. The MACD shows bearish divergence, and the ATR indicates increasing volatility. A close around 675 is likely.
Analysis
The stock has been volatile, with significant fluctuations. Recent candlestick patterns suggest indecision. Support at 670 is critical; a break below could lead to further declines.
Confidence Level
Potential Risks
Unforeseen macroeconomic events could lead to sudden price changes.
1 Month Prediction
Target: July 31, 2025$650
$670
$660
$640
Description
The bearish trend is expected to continue, with potential for further declines as market sentiment weakens. Fibonacci retracement levels suggest 650 as a target. Watch for volume spikes indicating reversals.
Analysis
The stock has shown a bearish trend with lower highs and lows. Key support at 650 is critical. Technical indicators suggest a potential continuation of the downtrend, but external factors could influence price.
Confidence Level
Potential Risks
Market sentiment can shift rapidly, impacting predictions.
3 Months Prediction
Target: September 30, 2025$620
$625
$630
$610
Description
Long-term bearish outlook as the stock struggles to maintain upward momentum. The overall market sentiment is cautious, and technical indicators suggest further declines. Expect a close around 620.
Analysis
The stock has faced significant resistance and is showing signs of a prolonged downtrend. Key support levels are being tested, and macroeconomic factors could further influence performance. A cautious approach is advised.
Confidence Level
Potential Risks
Long-term predictions are highly uncertain due to potential market shifts.