META Trading Predictions
1 Day Prediction
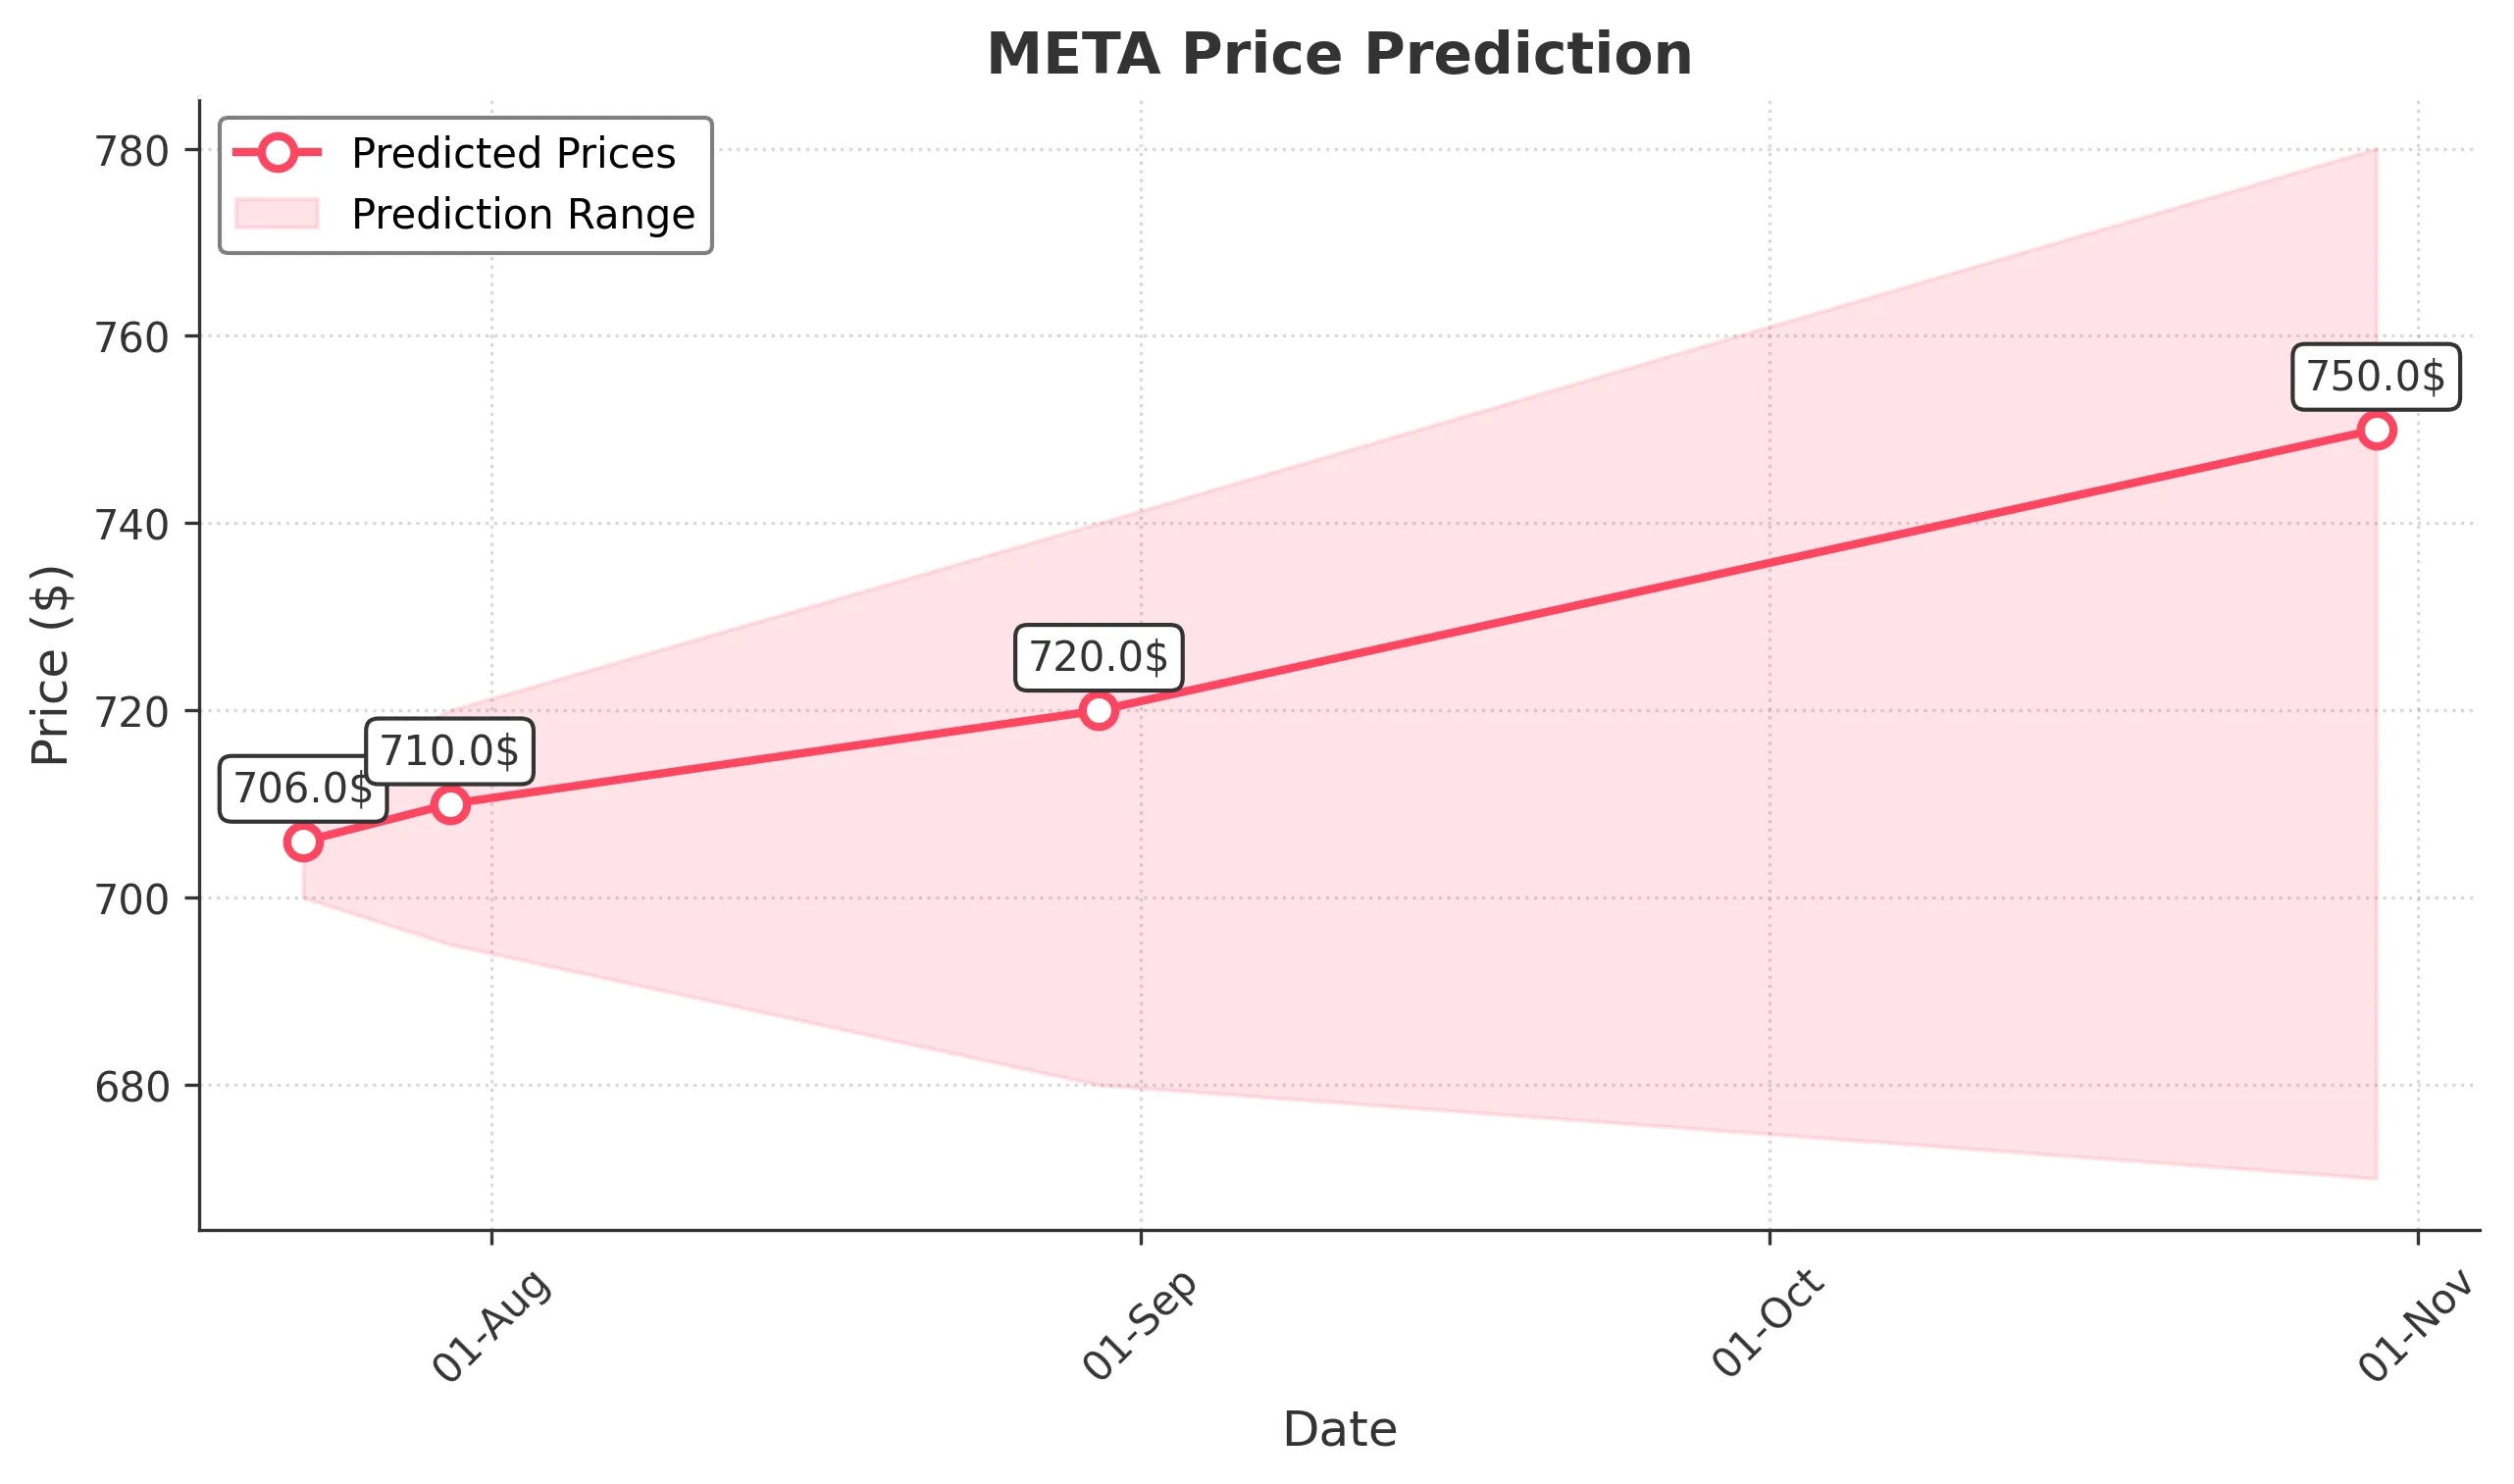
Target: July 23, 2025$706
$705
$712
$700
Description
The stock shows a slight bearish trend with recent lower highs. RSI indicates overbought conditions, suggesting a potential pullback. Volume has decreased, indicating weakening momentum. Expect a close around 706.
Analysis
Over the past 3 months, META has shown a bullish trend with significant upward movement. Key resistance at 738. Recent candlestick patterns indicate indecision, and volume has been declining, suggesting potential weakness. The MACD is flattening, indicating a possible trend reversal.
Confidence Level
Potential Risks
Market volatility and external news could impact the prediction. A sudden bullish sentiment could lead to higher prices.
1 Week Prediction
Target: July 30, 2025$710
$707
$720
$695
Description
Expect a slight recovery as the stock may find support around 700. The MACD shows a potential bullish crossover, but RSI remains high. Volume may increase as traders react to earnings reports.
Analysis
The stock has been in a bullish phase but is showing signs of consolidation. Key support at 700 is critical. The ATR indicates increasing volatility, and recent candlestick patterns suggest indecision. Market sentiment remains cautious.
Confidence Level
Potential Risks
Earnings reports and macroeconomic factors could lead to unexpected volatility. A bearish trend could persist if support levels fail.
1 Month Prediction
Target: August 30, 2025$720
$715
$740
$680
Description
A potential recovery towards 720 is expected as the stock stabilizes. The MACD may confirm a bullish trend, while RSI could normalize. Volume is anticipated to increase as traders react to market conditions.
Analysis
META has shown strong performance but is facing resistance around 740. The stock's volatility is increasing, and recent patterns indicate potential for a pullback. Key support at 680 is crucial for maintaining bullish sentiment.
Confidence Level
Potential Risks
Unforeseen market events or earnings surprises could lead to volatility. A failure to hold above 700 could trigger further declines.
3 Months Prediction
Target: October 30, 2025$750
$740
$780
$670
Description
Long-term bullish sentiment may push the stock towards 750, supported by positive earnings and market conditions. However, potential resistance at 780 could limit gains. Watch for volume spikes indicating strong buying interest.
Analysis
The overall trend remains bullish, with significant upward momentum. Key resistance levels are at 780, while support is at 670. The MACD indicates a strong bullish trend, and volume patterns suggest increasing interest. However, external factors could introduce volatility.
Confidence Level
Potential Risks
Macroeconomic factors and market sentiment shifts could impact the prediction. A downturn in tech stocks could lead to a bearish reversal.