META Trading Predictions
1 Day Prediction
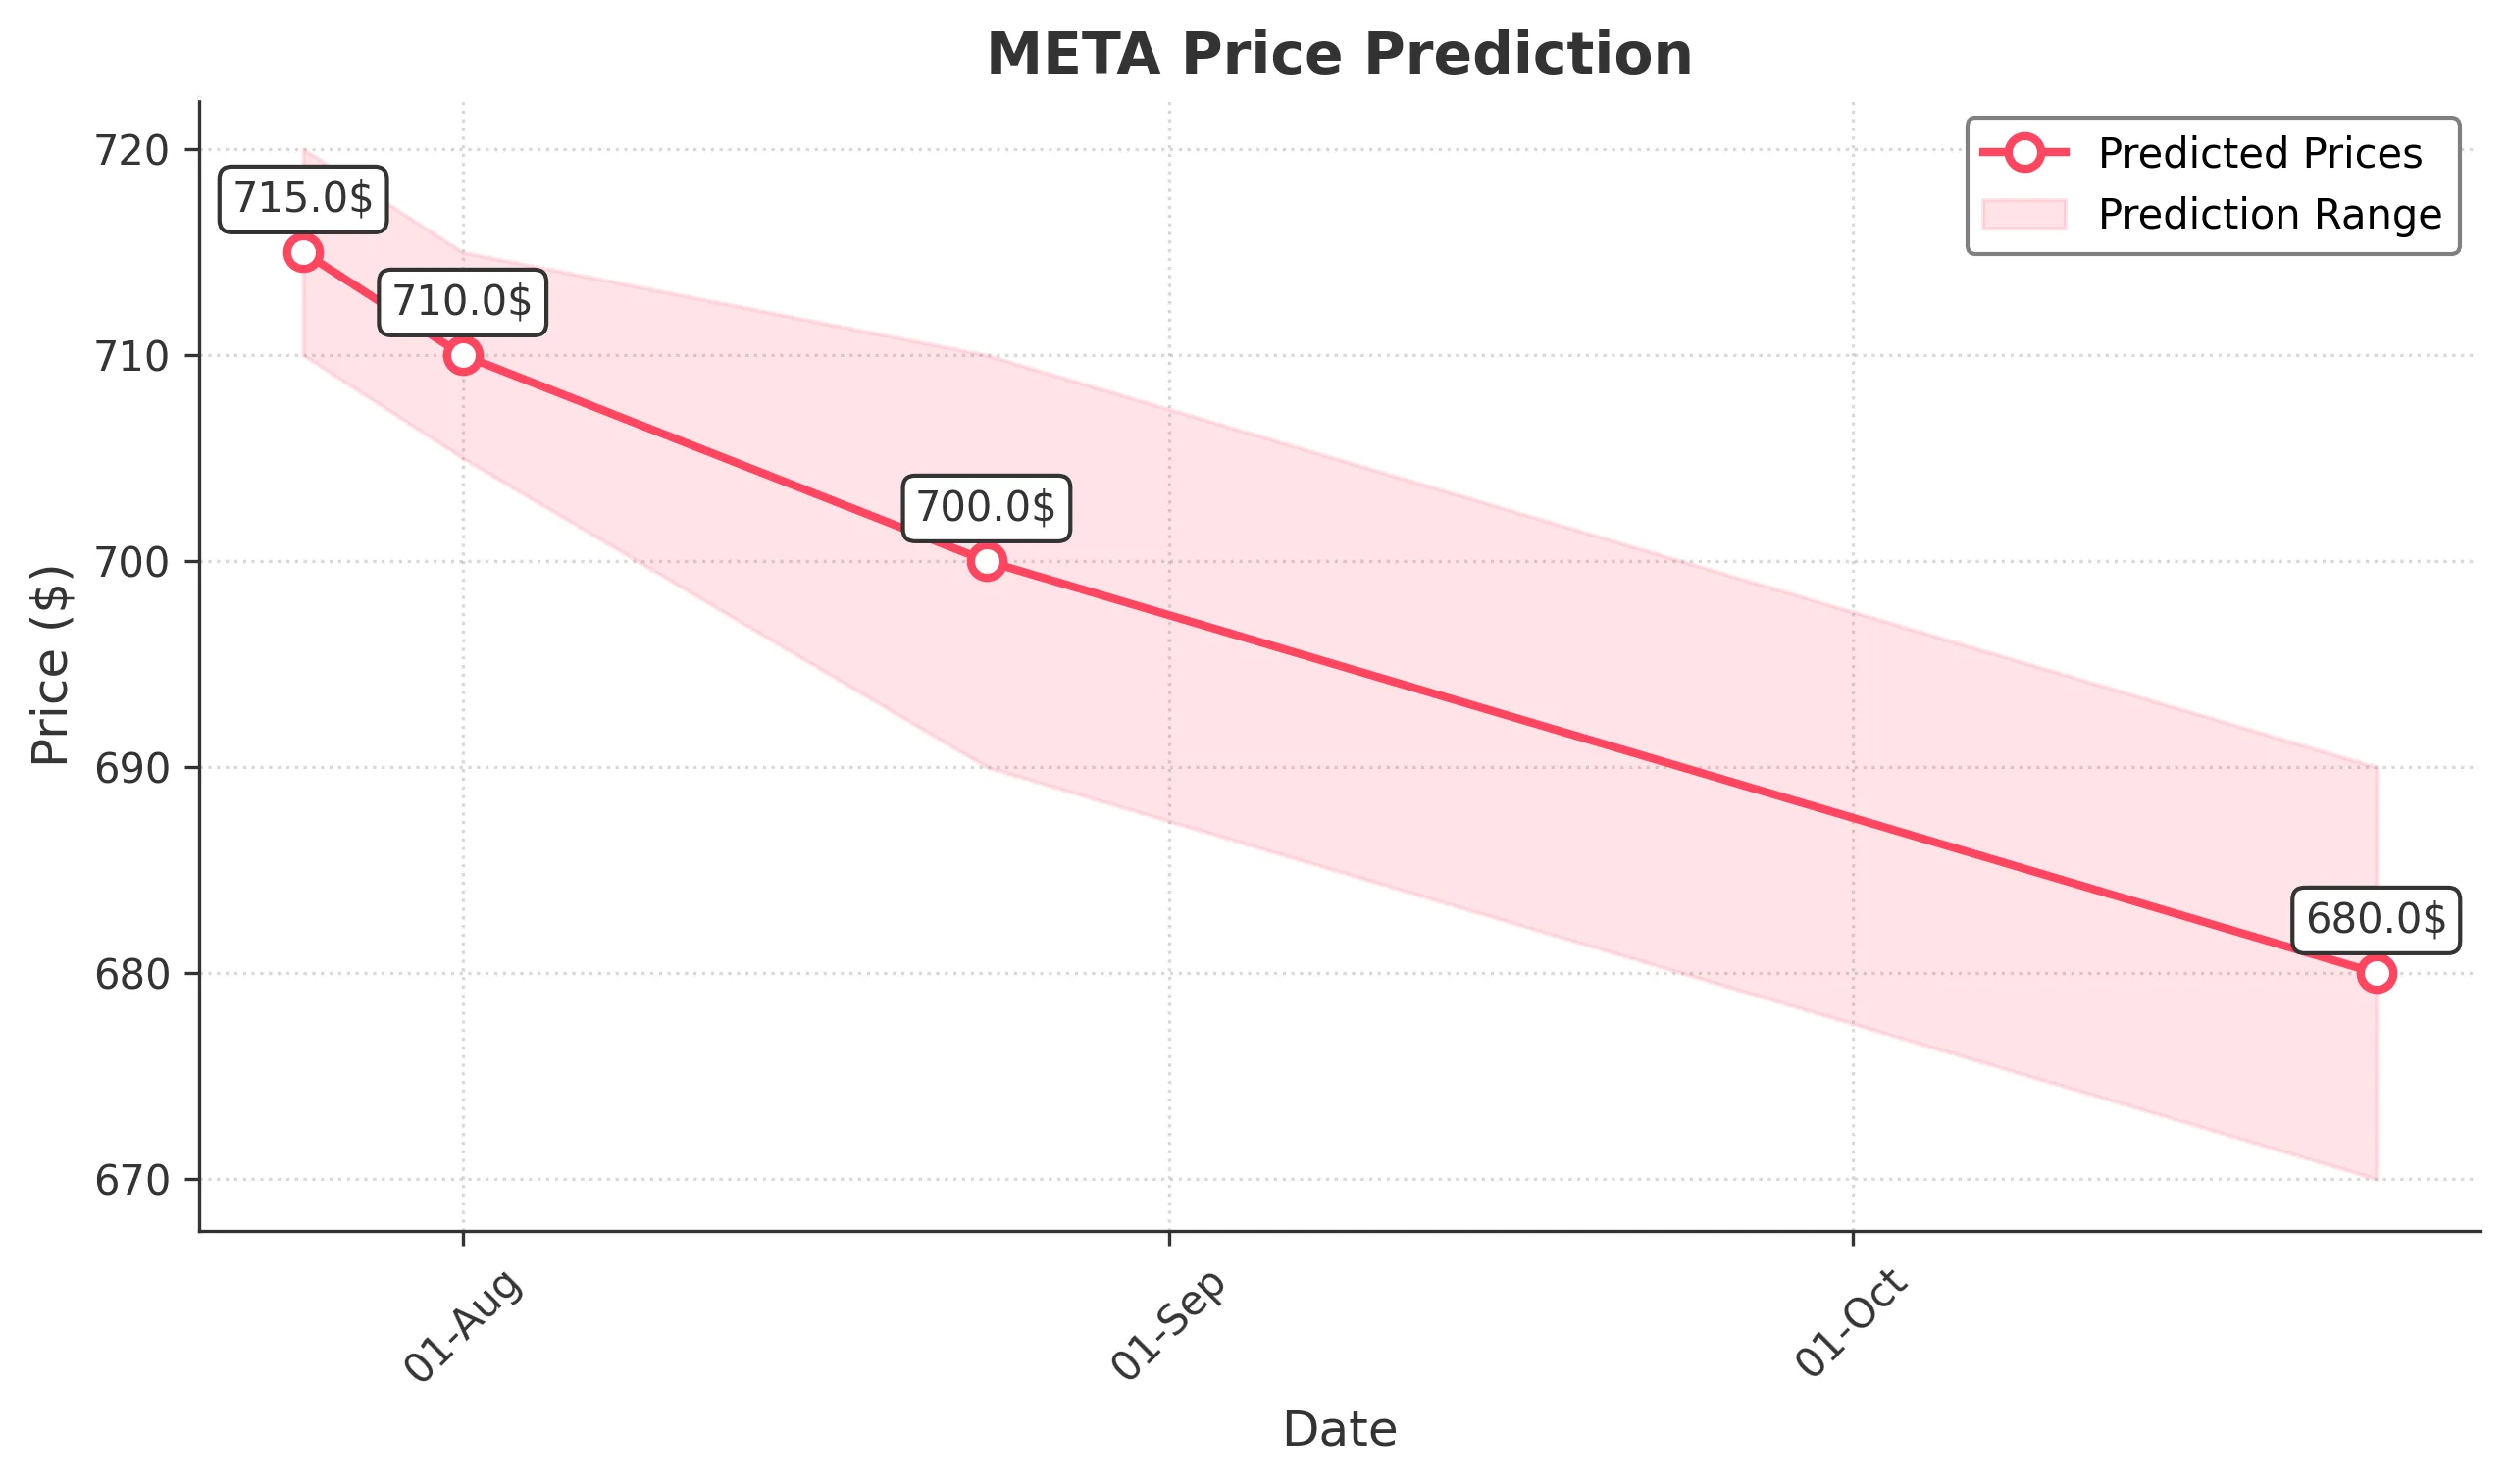
Target: July 25, 2025$715
$715.5
$720
$710
Description
The stock shows a slight bearish trend with recent lower highs. RSI indicates overbought conditions, suggesting a potential pullback. Volume has decreased, indicating weakening momentum. Expect a close around 715.00.
Analysis
Over the past 3 months, META has shown a bullish trend with significant highs. However, recent price action indicates a potential reversal with lower highs and increased selling pressure. Key support at 700.00.
Confidence Level
Potential Risks
Market volatility and external news could impact the price significantly.
1 Week Prediction
Target: August 1, 2025$710
$712
$715
$705
Description
The bearish trend may continue into next week as the stock struggles to maintain upward momentum. MACD shows a bearish crossover, and volume patterns suggest a lack of buying interest.
Analysis
The stock has been in a consolidation phase with resistance around 720.00. Recent candlestick patterns indicate indecision, and the overall market sentiment is cautious.
Confidence Level
Potential Risks
Unexpected market news or earnings reports could lead to volatility.
1 Month Prediction
Target: August 24, 2025$700
$705
$710
$690
Description
Expect further declines as the stock approaches key support levels. The RSI is trending downwards, indicating potential weakness. A close around 700.00 is likely as selling pressure increases.
Analysis
META has experienced a strong rally but is now facing resistance. The stock's performance is influenced by broader market trends and investor sentiment, which appear cautious.
Confidence Level
Potential Risks
Market sentiment can shift rapidly, and macroeconomic factors may influence the stock's performance.
3 Months Prediction
Target: October 24, 2025$680
$685
$690
$670
Description
Long-term bearish sentiment may prevail as the stock approaches critical support levels. The overall trend suggests a potential decline, with macroeconomic factors playing a significant role.
Analysis
The stock has shown signs of weakness with lower highs and increased selling pressure. Key support at 670.00 is critical, and a break below this level could lead to further declines.
Confidence Level
Potential Risks
Unforeseen market events or changes in investor sentiment could lead to volatility.