META Trading Predictions
1 Day Prediction
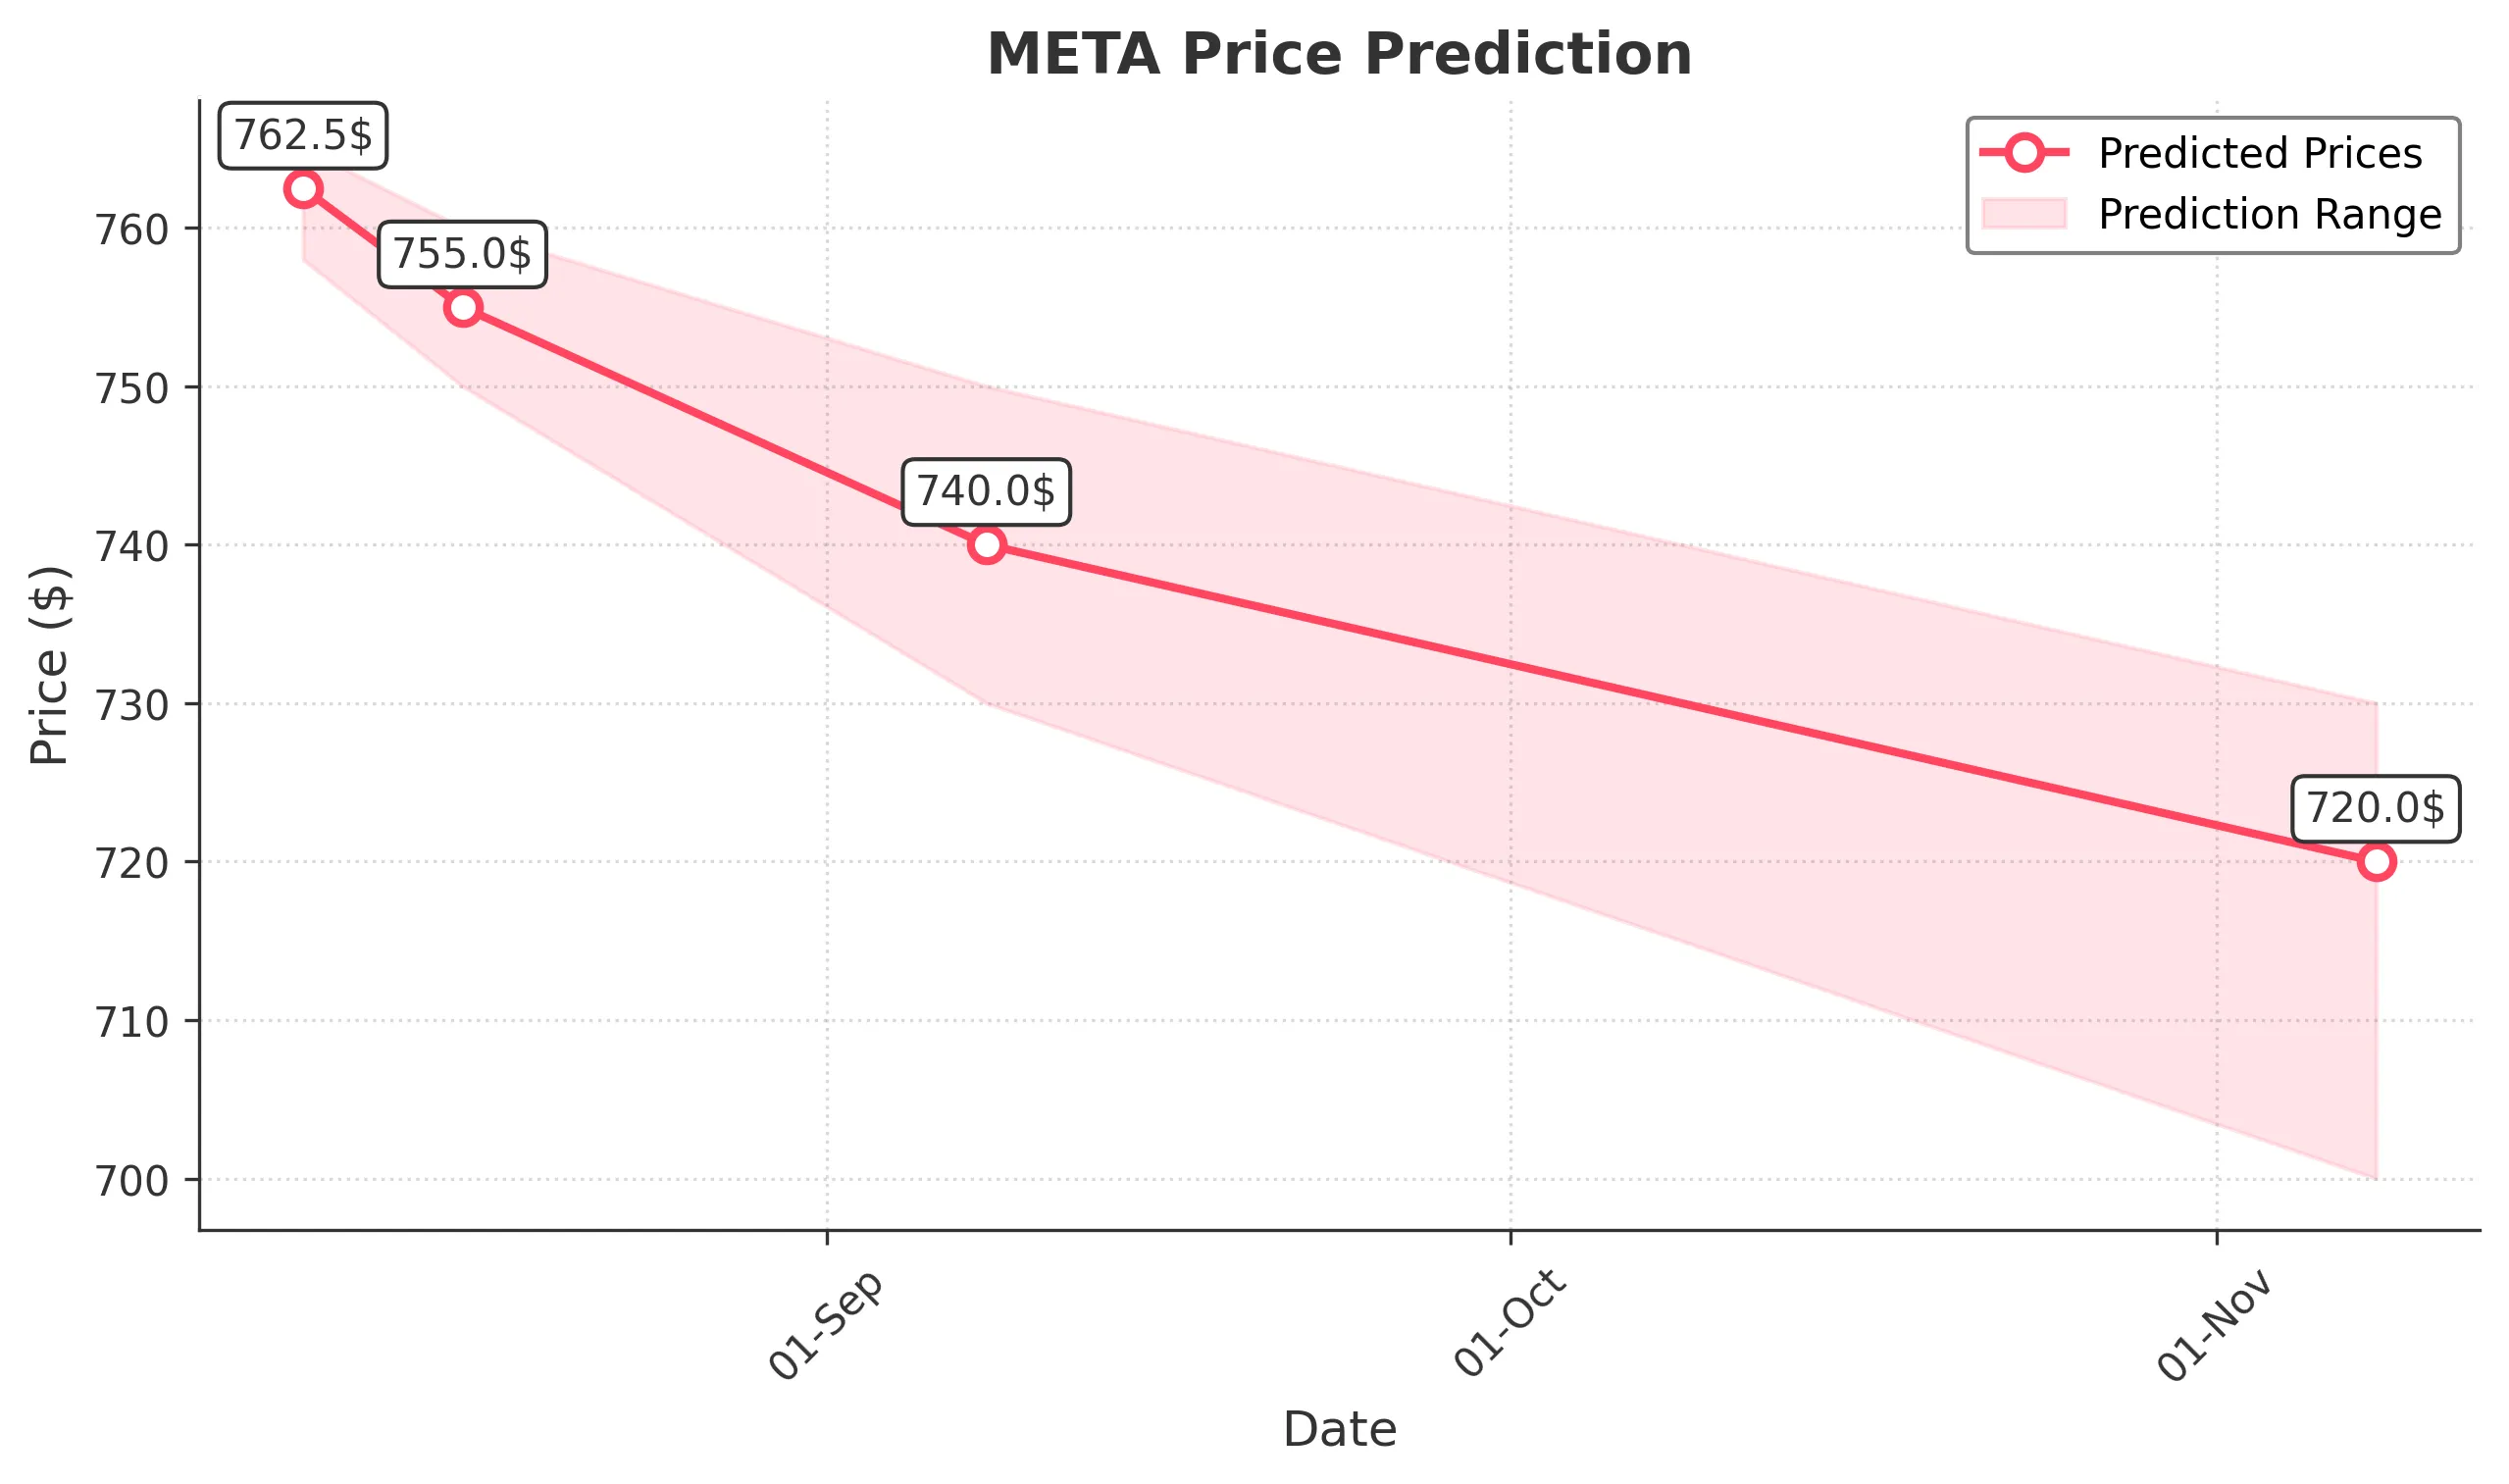
Target: August 9, 2025$762.5
$761.5
$765
$758
Description
The stock shows a slight bearish trend with a recent Doji candlestick indicating indecision. RSI is near 50, suggesting a neutral momentum. Volume is decreasing, which may lead to a consolidation phase.
Analysis
Over the past 3 months, META has shown volatility with a recent peak at 773.44. The stock has been oscillating around key support at 760.00 and resistance at 784.75. The MACD is showing a bearish crossover, indicating potential downward pressure.
Confidence Level
Potential Risks
Market sentiment could shift due to external news or earnings reports, impacting the prediction.
1 Week Prediction
Target: August 16, 2025$755
$760
$760
$750
Description
A bearish trend is expected as the stock approaches resistance levels. The MACD remains negative, and the RSI is trending downwards, indicating weakening momentum. Volume may increase as traders react to market conditions.
Analysis
The stock has been in a bearish phase recently, with significant selling pressure observed. Key support at 750.00 is critical; a break below could lead to further declines. The ATR indicates increased volatility, suggesting caution.
Confidence Level
Potential Risks
Potential for unexpected market events or earnings announcements could lead to volatility.
1 Month Prediction
Target: September 8, 2025$740
$745
$750
$730
Description
The bearish trend is likely to continue as the stock approaches key support levels. The RSI indicates oversold conditions, but the MACD remains negative, suggesting further downside potential.
Analysis
META has experienced significant fluctuations, with a recent high of 773.44. The stock is currently testing support at 740.00. The Bollinger Bands indicate potential for a breakout, but the overall trend remains bearish.
Confidence Level
Potential Risks
Market sentiment could shift based on macroeconomic factors or company news, impacting the prediction.
3 Months Prediction
Target: November 8, 2025$720
$725
$730
$700
Description
The stock may continue to decline as bearish sentiment prevails. The MACD indicates a strong bearish trend, and the RSI suggests oversold conditions, which could lead to a temporary bounce but overall downward pressure.
Analysis
Over the past three months, META has shown a bearish trend with significant resistance at 750.00. The stock's performance has been influenced by macroeconomic factors, and the overall market sentiment remains cautious, indicating potential for further declines.
Confidence Level
Potential Risks
Unforeseen market events or changes in investor sentiment could significantly alter the stock's trajectory.