META Trading Predictions
1 Day Prediction
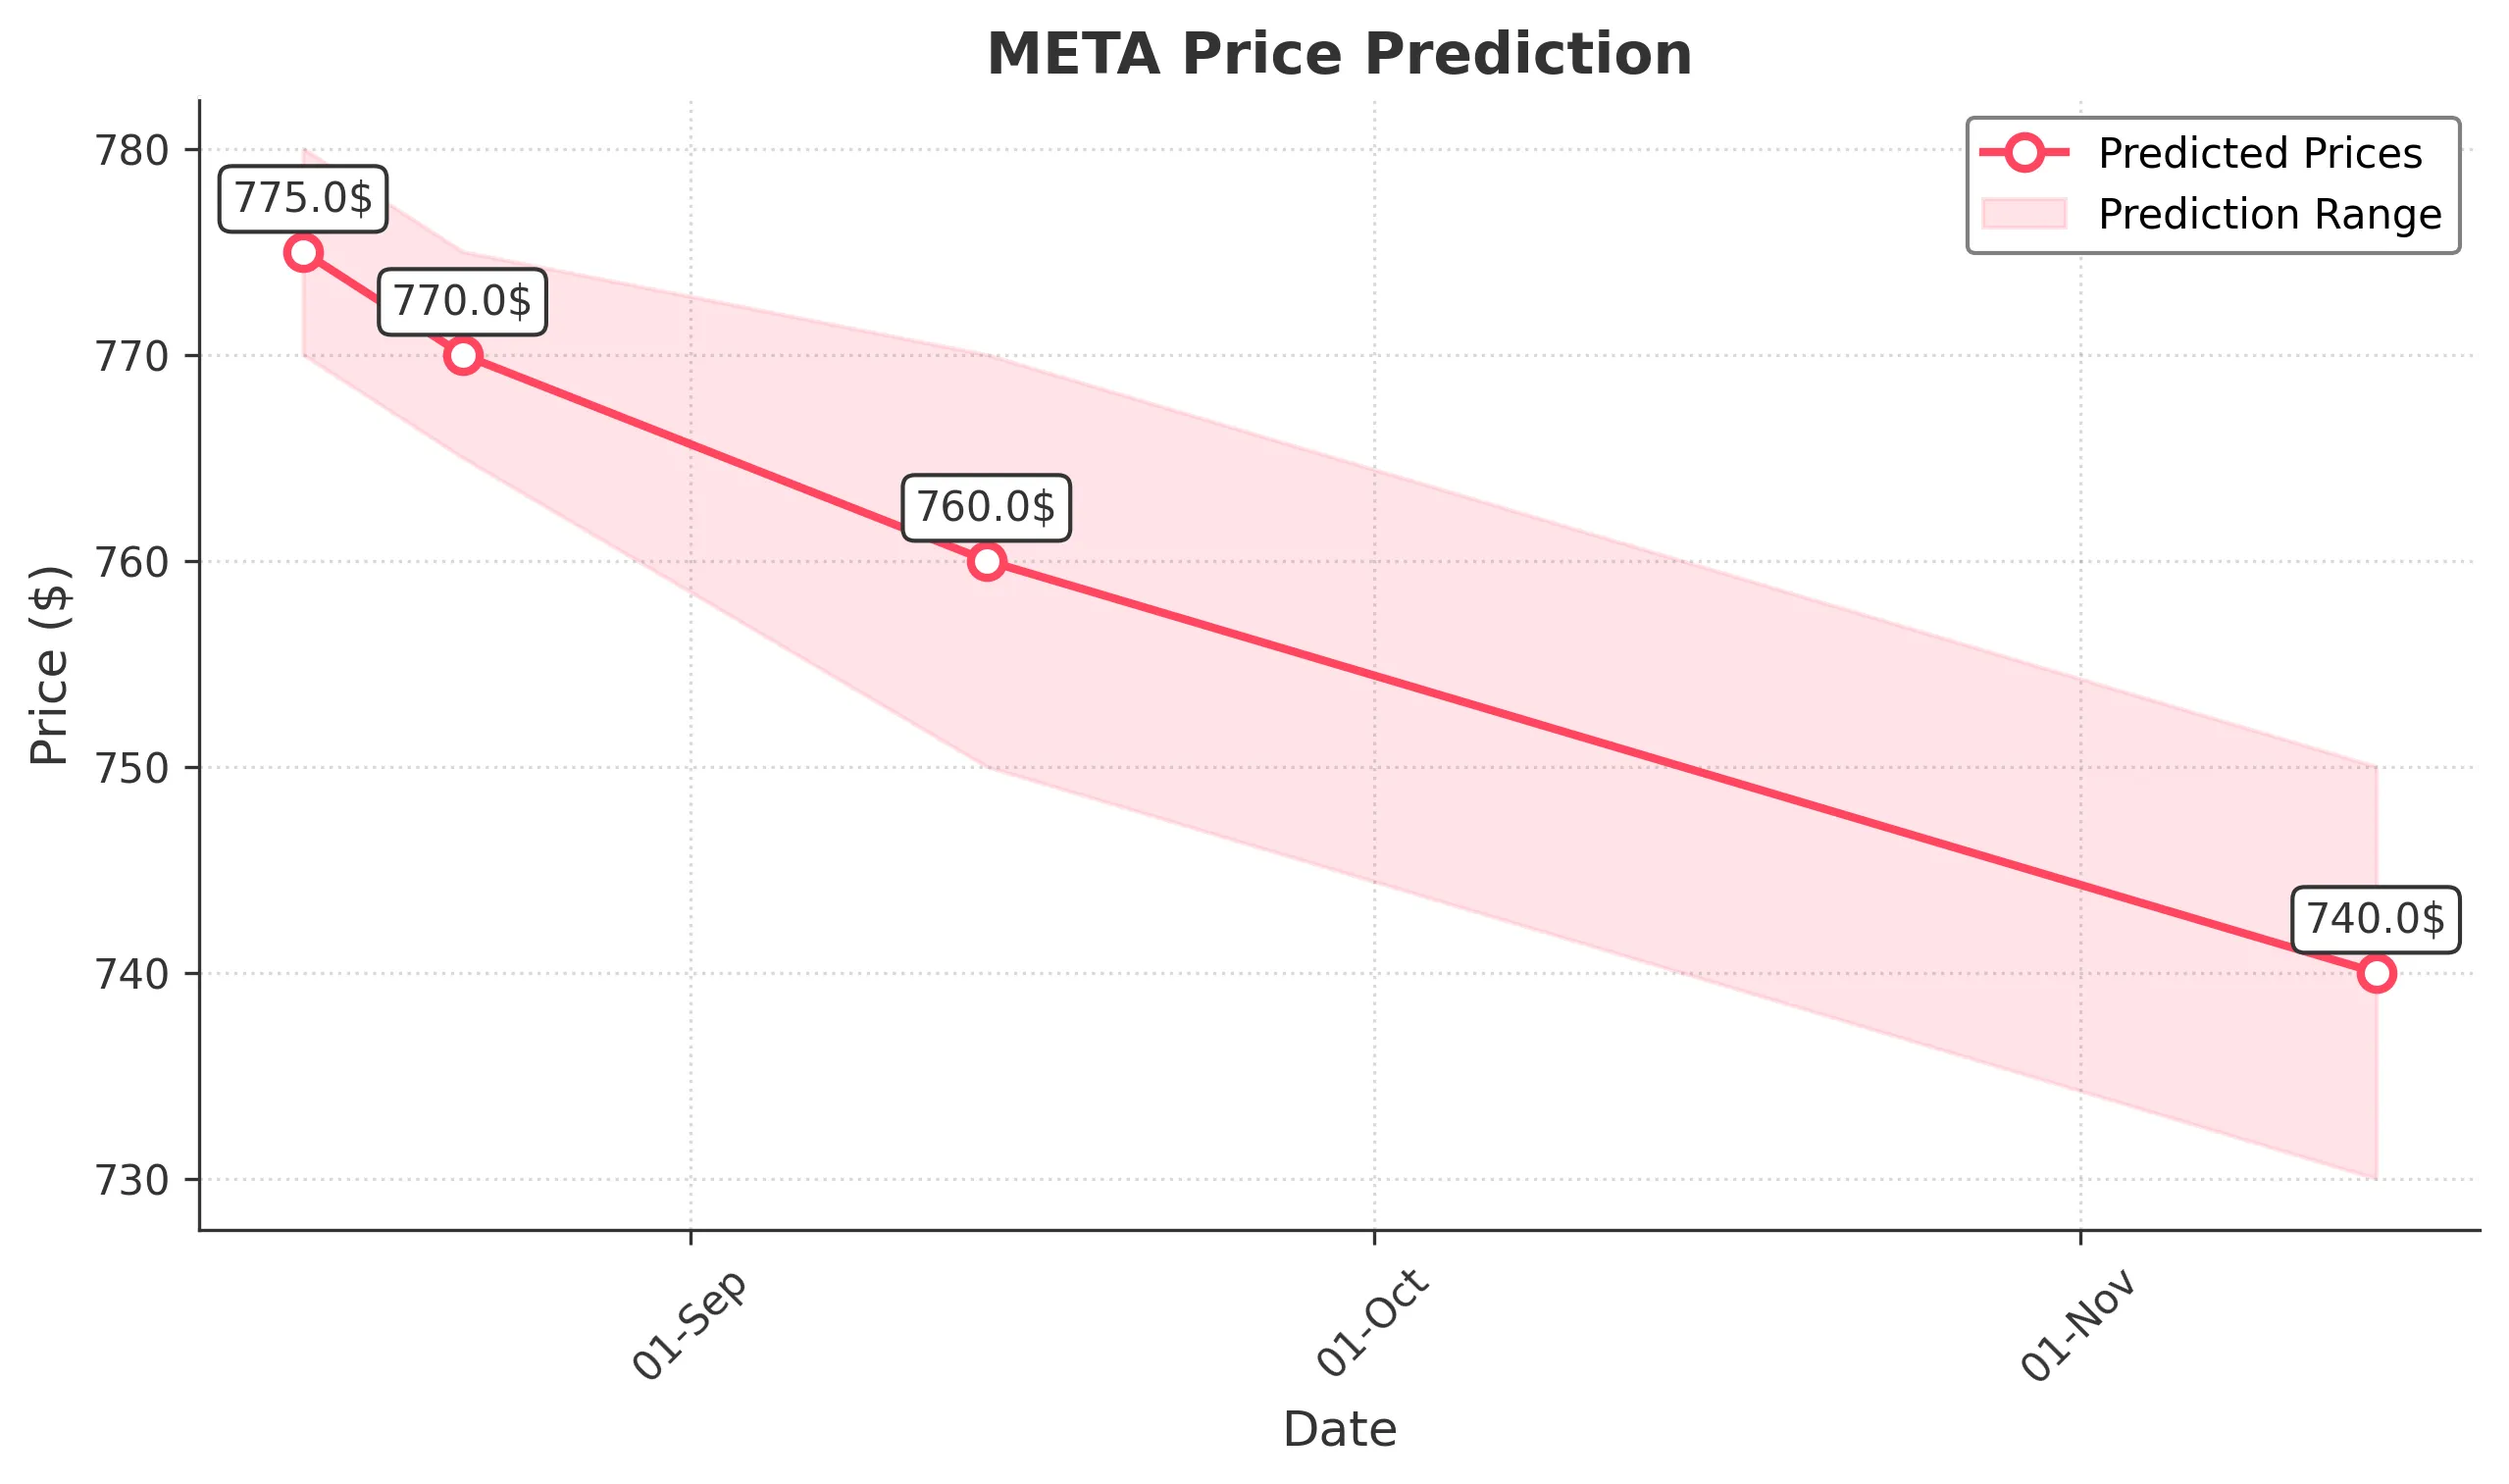
Target: August 15, 2025$775
$772
$780
$770
Description
The stock shows a slight bearish trend with a recent Doji candlestick indicating indecision. RSI is near 50, suggesting a potential reversal. Volume is decreasing, indicating weakening momentum.
Analysis
Over the past 3 months, META has shown volatility with significant price swings. Key support at 700 and resistance at 800. Recent bearish patterns and declining volume suggest caution, but bullish momentum remains possible.
Confidence Level
Potential Risks
Market sentiment could shift due to external news or earnings reports, impacting the prediction.
1 Week Prediction
Target: August 22, 2025$770
$772
$775
$765
Description
The stock is expected to consolidate around current levels. The MACD shows a bearish crossover, and the RSI is approaching overbought territory. A potential pullback is likely, but support at 750 may hold.
Analysis
META has experienced a bullish run but is now facing resistance. The ATR indicates increased volatility, and recent candlestick patterns suggest a potential reversal. Key support at 750 and resistance at 800.
Confidence Level
Potential Risks
Unforeseen market events or earnings surprises could lead to volatility, affecting the accuracy of this prediction.
1 Month Prediction
Target: September 14, 2025$760
$765
$770
$750
Description
A bearish trend is anticipated as the stock approaches key resistance levels. The RSI indicates overbought conditions, and the MACD is showing signs of divergence. A correction may occur.
Analysis
The stock has shown strong performance but is now at risk of a pullback. Key support at 750 and resistance at 800. Technical indicators suggest a potential correction, but bullish sentiment remains.
Confidence Level
Potential Risks
Market sentiment can shift rapidly, and external factors such as economic data releases may impact stock performance.
3 Months Prediction
Target: November 14, 2025$740
$745
$750
$730
Description
A bearish outlook is expected as the stock may face continued selling pressure. The MACD indicates a bearish trend, and the RSI is trending downwards. Support at 730 is critical.
Analysis
META's performance has been volatile, with significant price fluctuations. The stock is currently facing resistance at 800 and support at 730. Technical indicators suggest a bearish trend, but external factors could influence future performance.
Confidence Level
Potential Risks
Long-term predictions are subject to greater uncertainty due to potential market shifts and macroeconomic factors.