MSFT Trading Predictions
1 Day Prediction
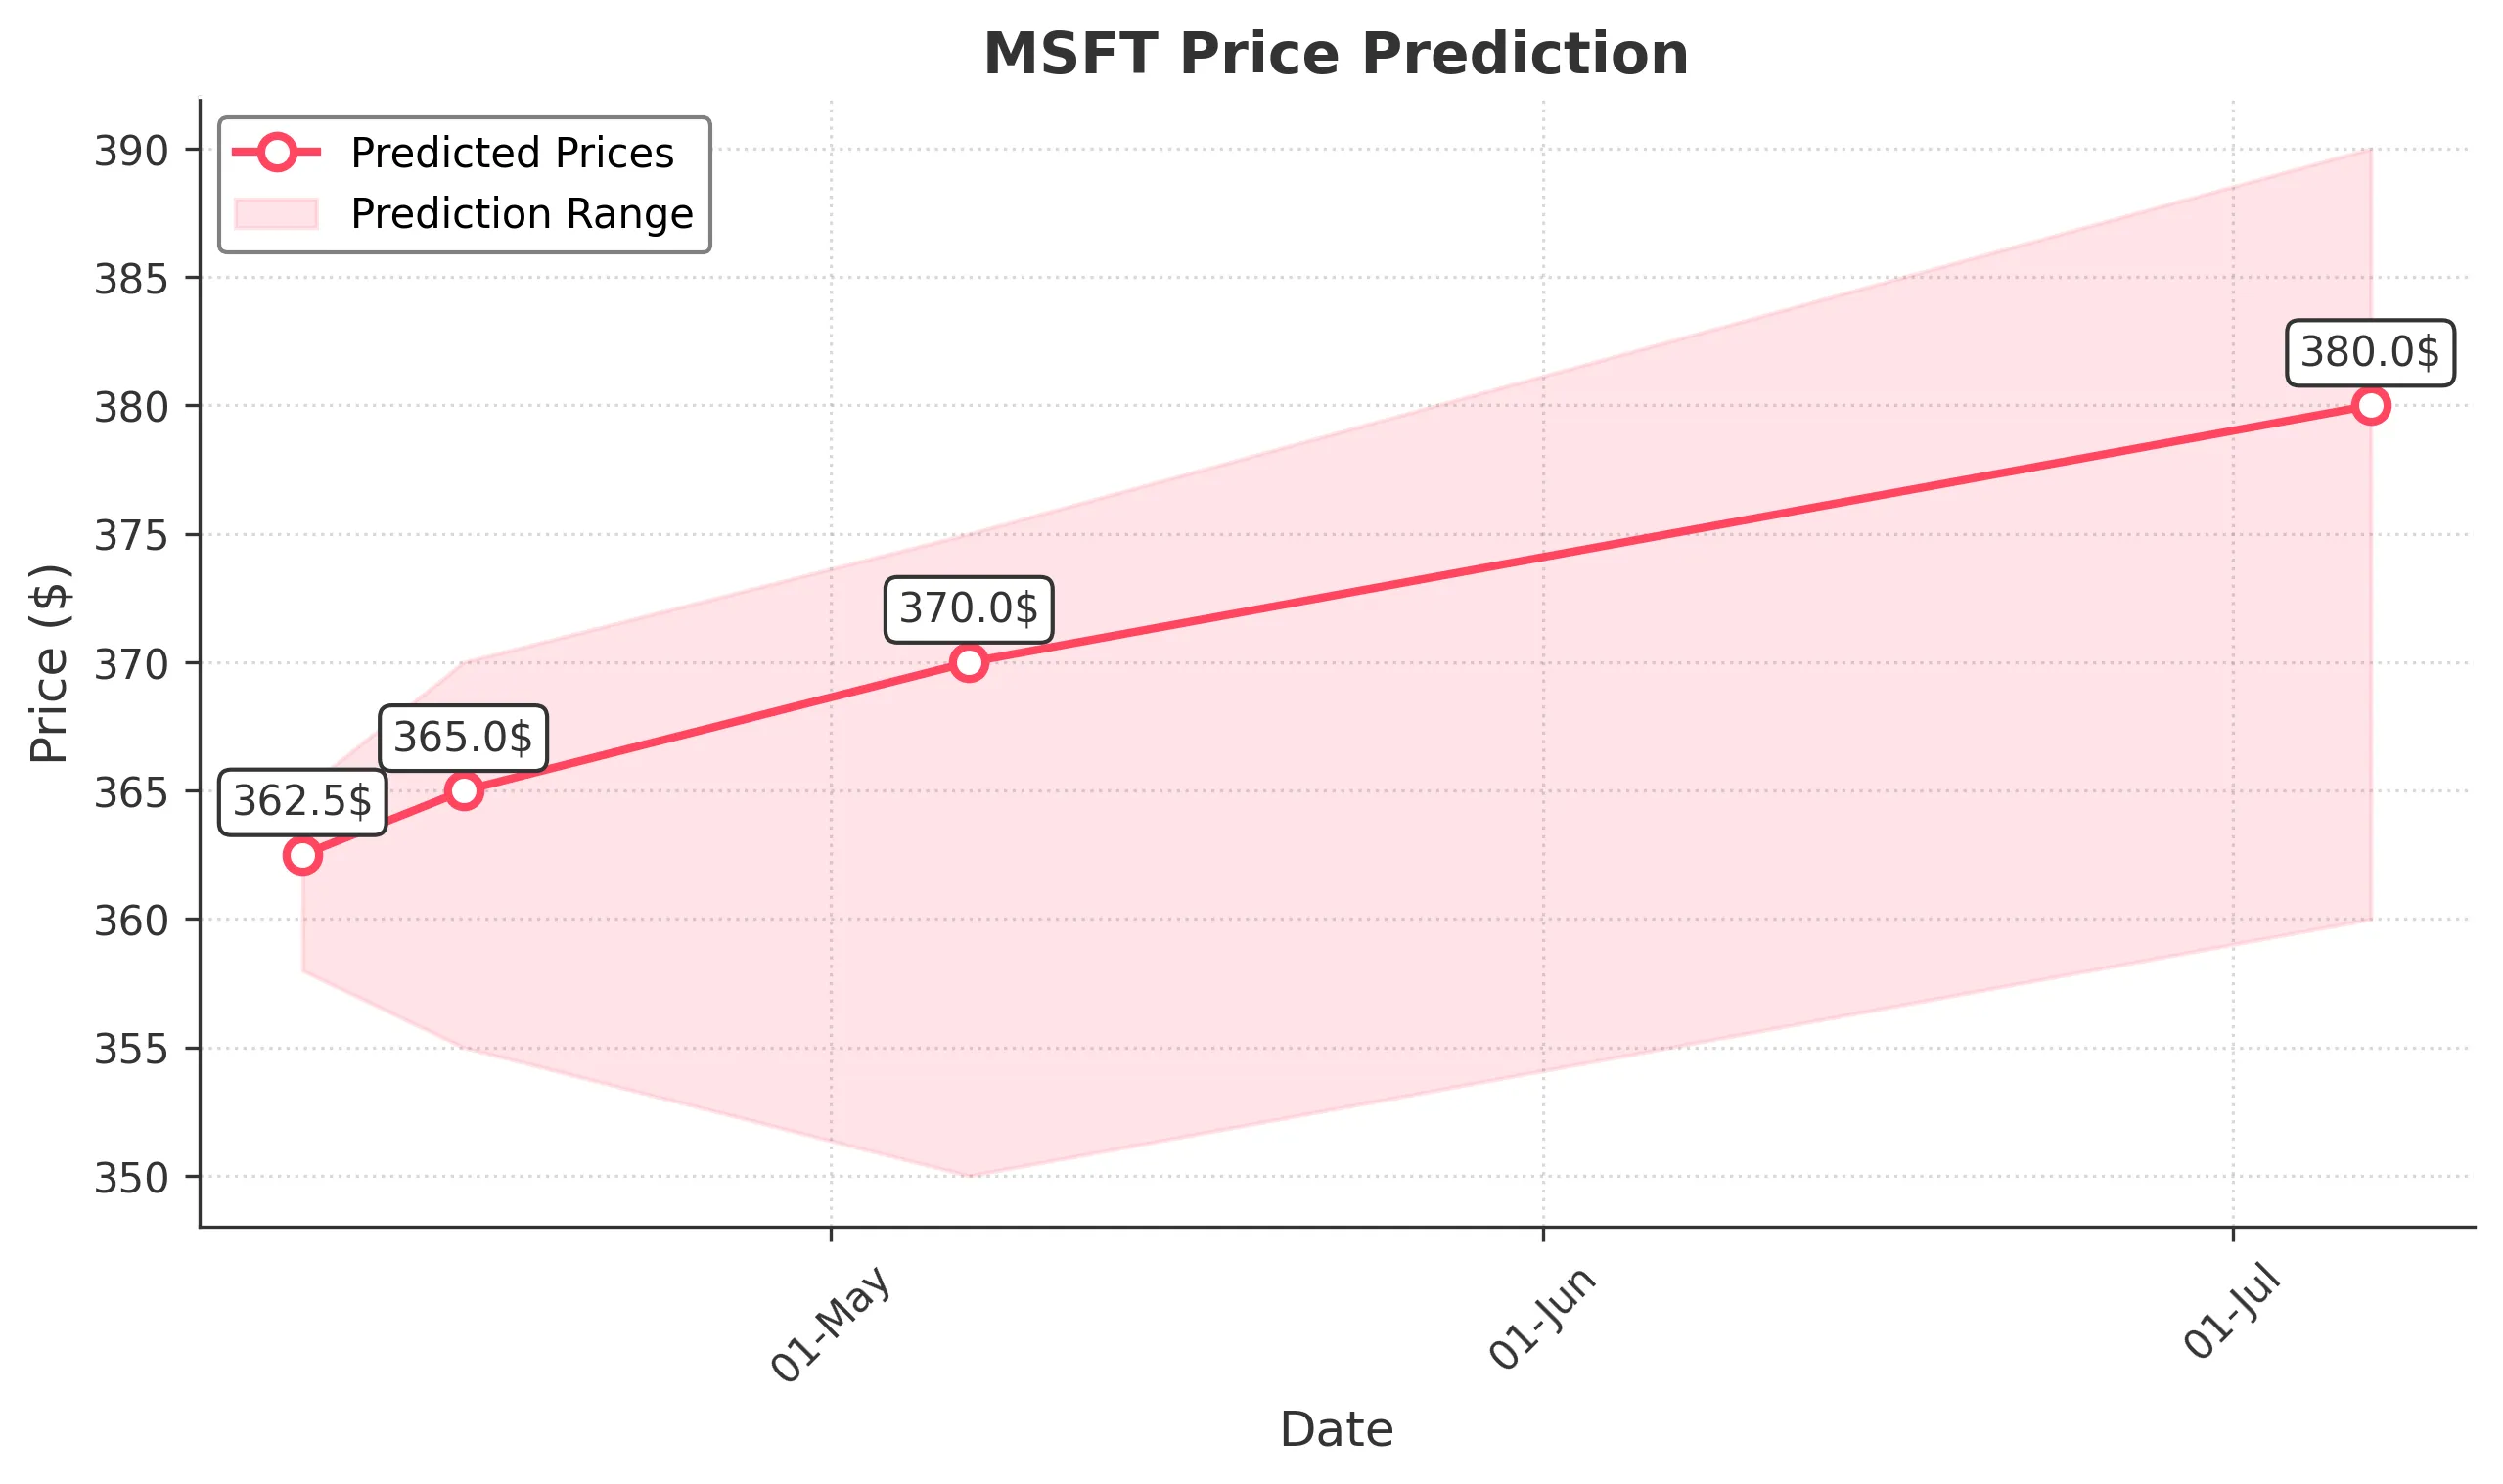
Target: April 8, 2025$362.5
$360
$365
$358
Description
The stock shows a slight bullish trend with a potential recovery from recent lows. RSI indicates oversold conditions, while MACD suggests a bullish crossover. However, volatility remains high, and market sentiment is cautious.
Analysis
Over the past 3 months, MSFT has experienced significant volatility, with a bearish trend recently. Key support is around $360, while resistance is near $375. Volume spikes indicate strong selling pressure, and the overall sentiment is mixed.
Confidence Level
Potential Risks
Market volatility and external news could impact the prediction. A sudden downturn is possible if selling pressure increases.
1 Week Prediction
Target: April 15, 2025$365
$362
$370
$355
Description
A potential rebound is expected as the stock approaches key support levels. The RSI is improving, indicating a possible reversal. However, the MACD remains bearish, suggesting caution. Volume may increase as traders react to earnings reports.
Analysis
MSFT has shown a bearish trend recently, with significant resistance at $375. The stock's performance has been influenced by broader market conditions and tech sector sentiment. Key support at $360 is critical for a potential recovery.
Confidence Level
Potential Risks
Earnings reports and macroeconomic data could lead to unexpected volatility. A bearish trend could resume if negative news emerges.
1 Month Prediction
Target: May 7, 2025$370
$365
$375
$350
Description
The stock may stabilize around $370 as it tests resistance levels. The RSI is approaching neutral, indicating potential for upward movement. However, MACD remains bearish, and external factors could influence market sentiment.
Analysis
MSFT's performance has been characterized by high volatility and bearish sentiment. Key support at $360 and resistance at $375 are critical levels. The stock's future performance will depend on broader market trends and tech sector developments.
Confidence Level
Potential Risks
Unforeseen market events or economic data releases could lead to volatility. The bearish trend may resume if selling pressure increases.
3 Months Prediction
Target: July 7, 2025$380
$375
$390
$360
Description
A gradual recovery is anticipated as the stock tests higher resistance levels. The RSI may improve, indicating bullish momentum. However, macroeconomic factors and market sentiment could lead to fluctuations.
Analysis
Over the past 3 months, MSFT has faced significant challenges, with a bearish trend dominating. Key support at $360 and resistance at $375 will be crucial in determining future price movements. Market sentiment remains cautious amid economic uncertainties.
Confidence Level
Potential Risks
Long-term predictions are uncertain due to potential market shifts and economic conditions. A bearish trend could re-emerge if negative news impacts investor sentiment.