MSFT Trading Predictions
1 Day Prediction
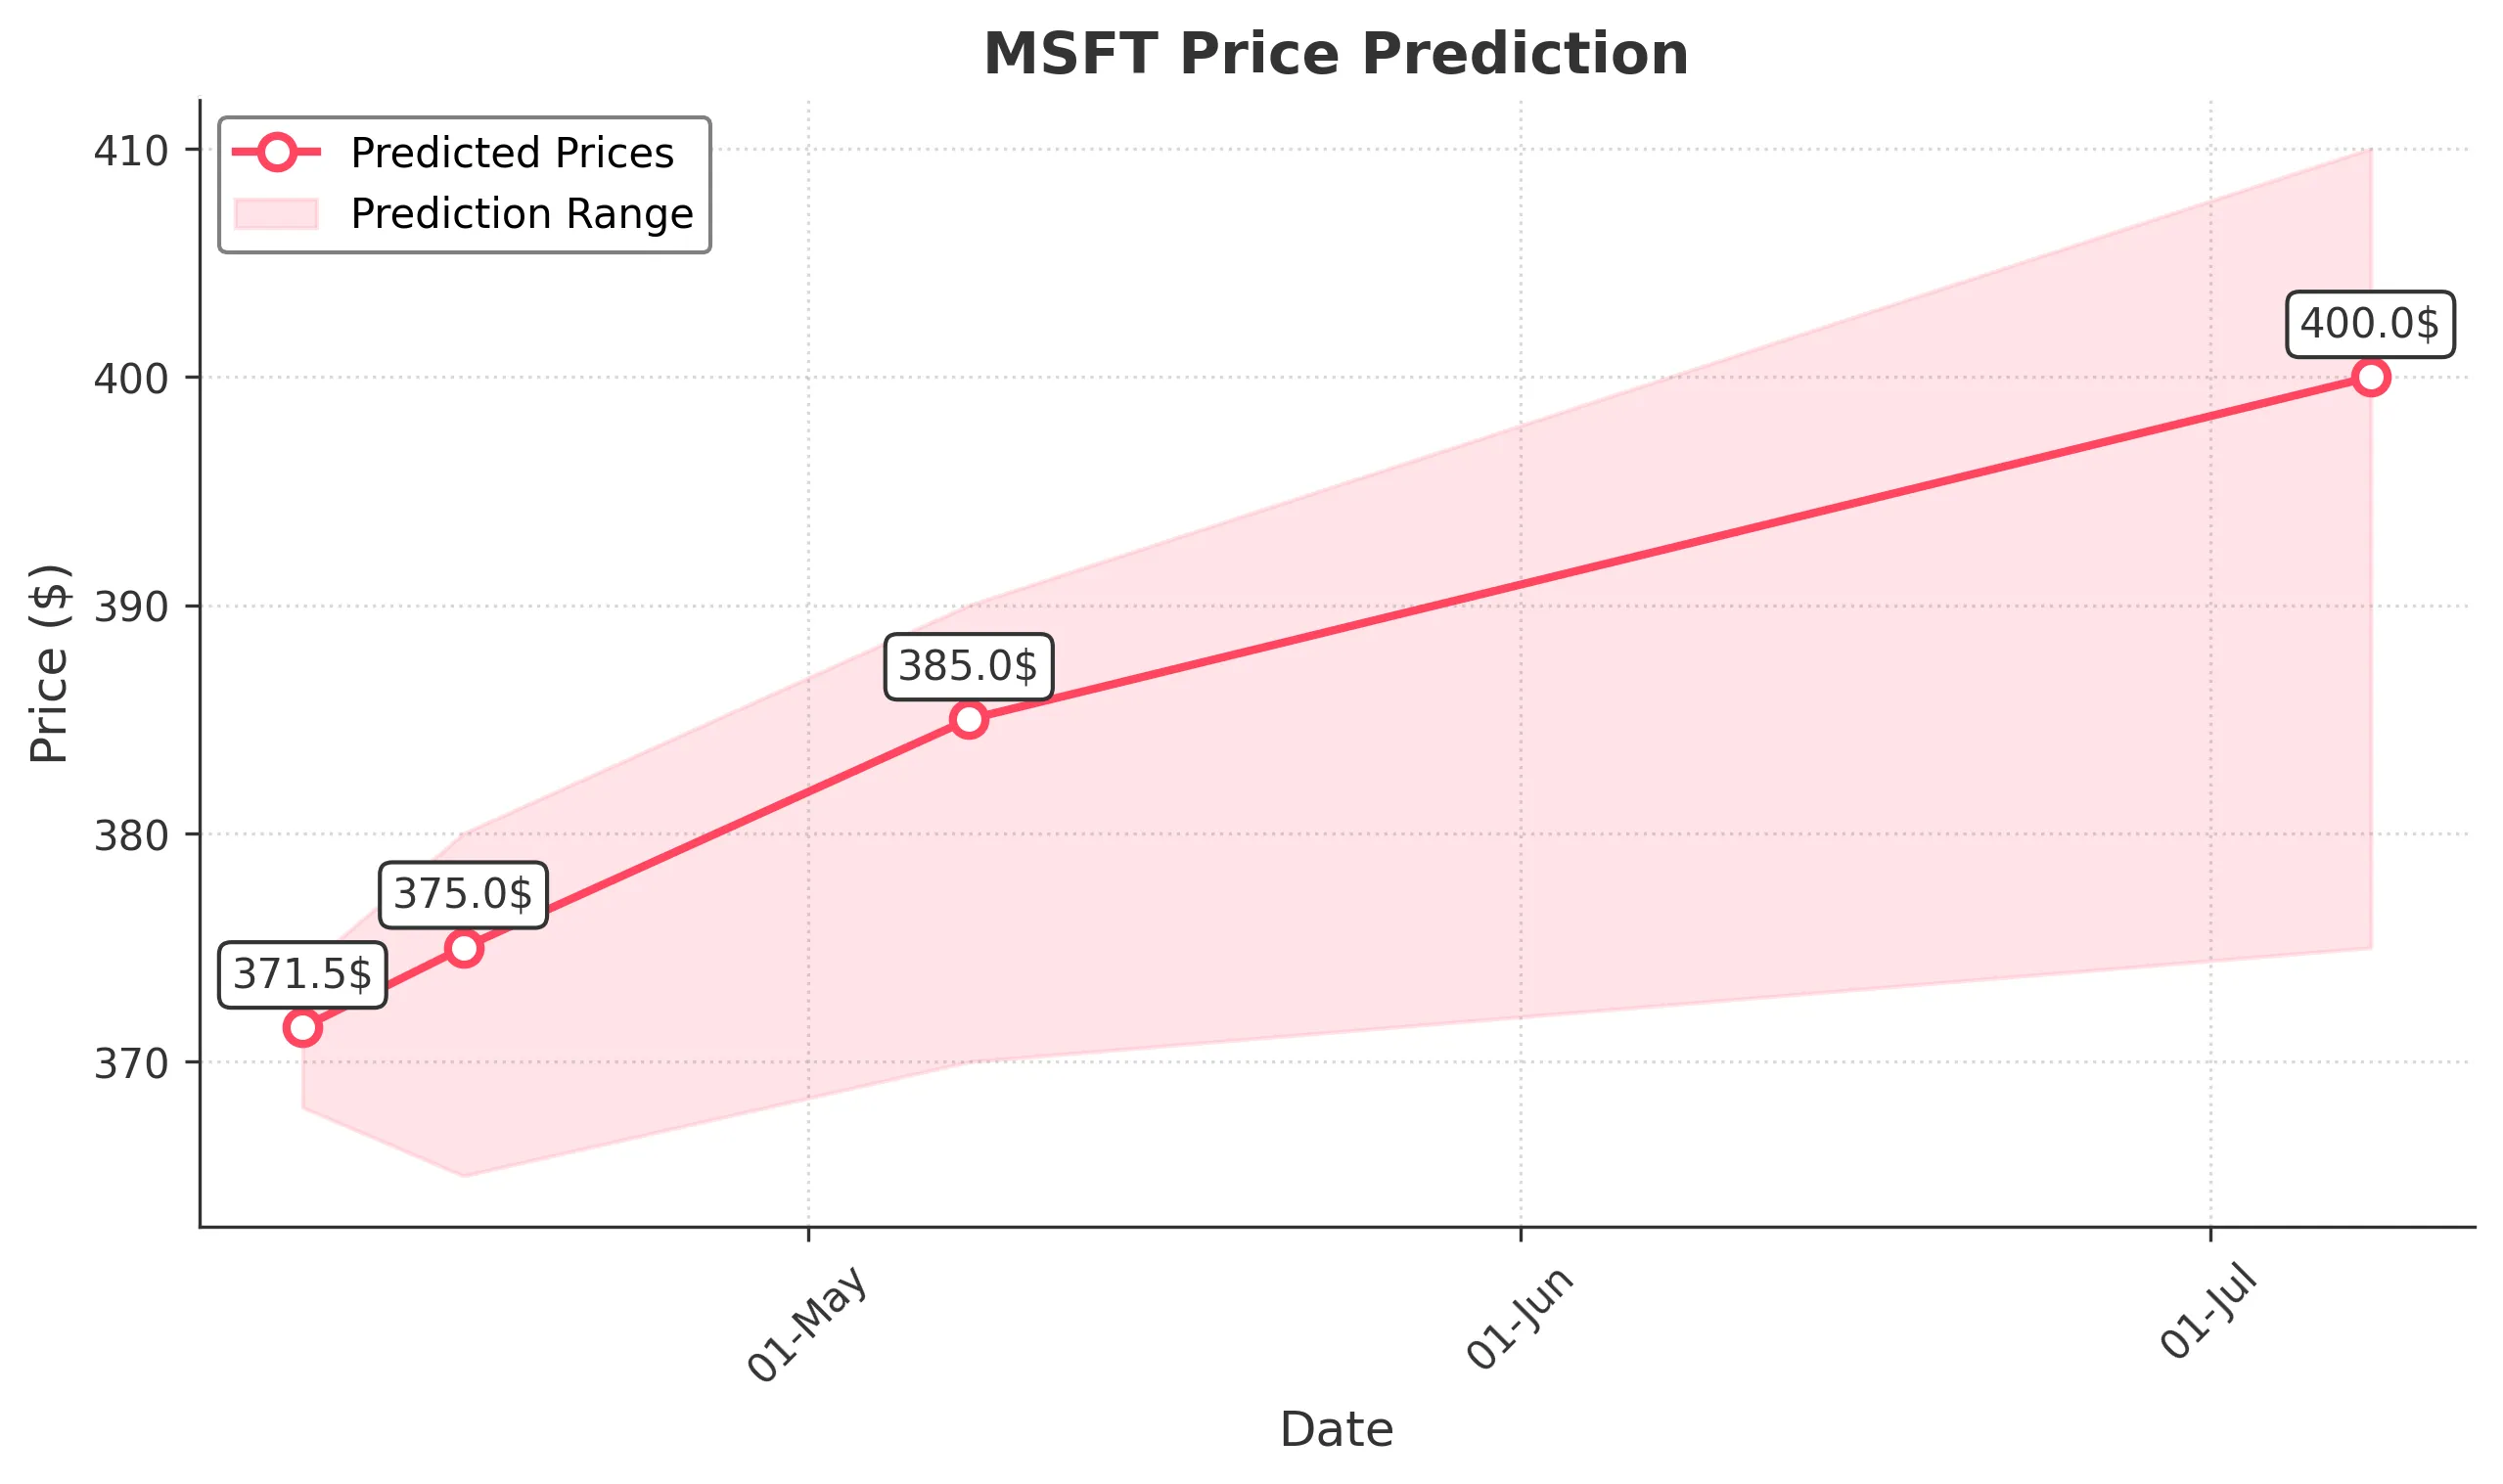
Target: April 9, 2025$371.5
$370
$374
$368
Description
The stock shows a slight bullish trend with a potential bounce from recent lows. RSI indicates oversold conditions, while MACD is showing a bullish crossover. However, volatility remains high, suggesting caution.
Analysis
Over the past 3 months, MSFT has experienced significant volatility, with a bearish trend recently. Key support at $359.84 and resistance at $382.14. Volume spikes indicate potential reversals, but overall sentiment remains cautious.
Confidence Level
Potential Risks
Market sentiment could shift due to macroeconomic news or earnings reports, which may impact the prediction.
1 Week Prediction
Target: April 16, 2025$375
$372
$380
$365
Description
Expect a gradual recovery as the stock may find support around $365. The RSI is improving, and MACD shows potential bullish momentum. However, external factors could still lead to fluctuations.
Analysis
The stock has been in a bearish phase, with recent lows indicating a need for a correction. Key resistance at $382.14 and support at $359.84. Volume analysis shows increased activity, suggesting traders are positioning for a rebound.
Confidence Level
Potential Risks
Uncertainty in the broader market and potential earnings surprises could lead to unexpected price movements.
1 Month Prediction
Target: May 8, 2025$385
$375
$390
$370
Description
A bullish trend is anticipated as the stock may recover towards $385. Positive divergence in RSI and MACD supports this outlook, but caution is advised due to potential market corrections.
Analysis
MSFT has shown a bearish trend recently, but signs of recovery are emerging. Key support at $359.84 and resistance at $382.14. Volume patterns indicate increased interest, suggesting a potential upward move if market conditions stabilize.
Confidence Level
Potential Risks
Market volatility and economic indicators could impact the stock's recovery trajectory.
3 Months Prediction
Target: July 8, 2025$400
$385
$410
$375
Description
Long-term outlook suggests a recovery towards $400, supported by improving fundamentals and technical indicators. However, macroeconomic factors could introduce volatility.
Analysis
The stock has faced significant volatility, with a bearish trend recently. Key support at $359.84 and resistance at $382.14. The overall market sentiment is cautious, but if conditions improve, a recovery towards $400 is plausible.
Confidence Level
Potential Risks
Potential economic downturns or changes in market sentiment could hinder growth.