MSFT Trading Predictions
1 Day Prediction
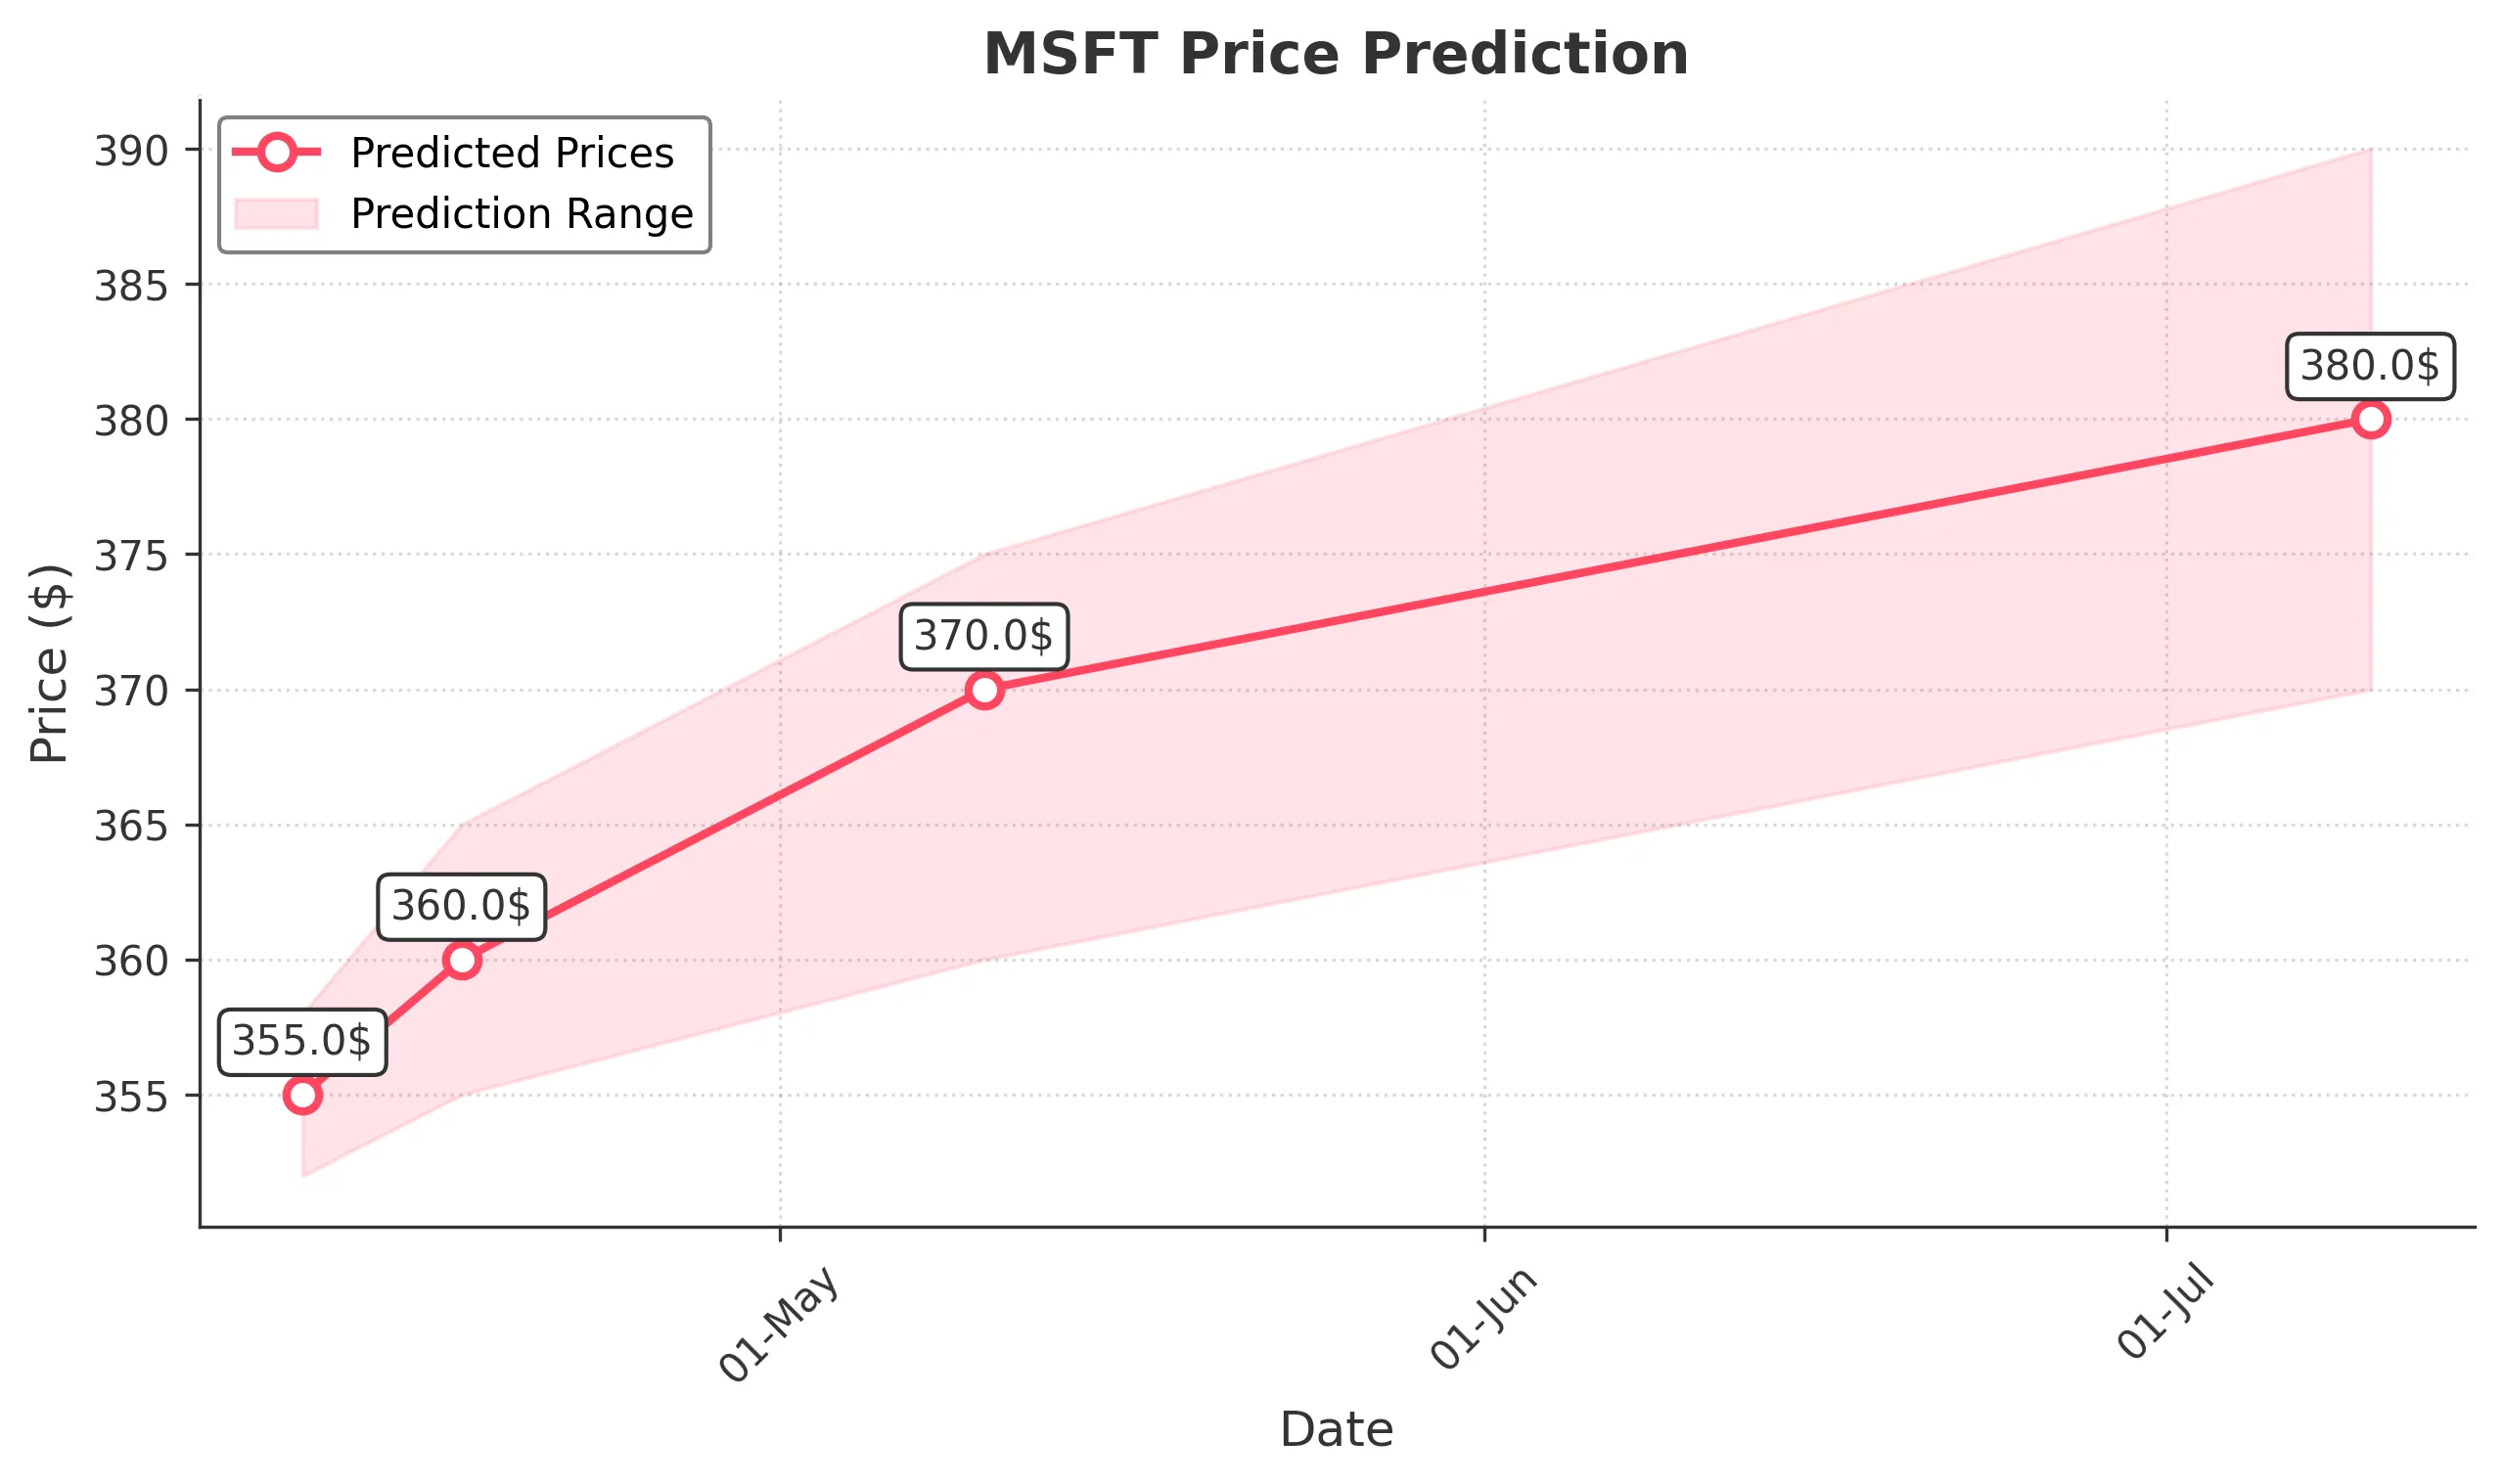
Target: April 10, 2025$355
$356
$358
$352
Description
The stock shows bearish momentum with a recent downtrend. The RSI indicates oversold conditions, but a potential bounce could occur. Volume spikes suggest increased selling pressure. Watch for support around 352.
Analysis
Over the past 3 months, MSFT has shown a bearish trend, with significant support at 352. Technical indicators like MACD are bearish, and the ATR indicates increased volatility. Volume patterns show spikes during sell-offs, suggesting caution.
Confidence Level
Potential Risks
Market volatility and external news could impact the prediction. A reversal is possible if bullish sentiment returns.
1 Week Prediction
Target: April 17, 2025$360
$358
$365
$355
Description
A slight recovery is anticipated as the stock may find support at 355. The RSI is approaching neutral, indicating potential for a rebound. However, bearish sentiment remains prevalent.
Analysis
The stock has been in a downtrend, with key support at 355. Technical indicators suggest a potential short-term recovery, but overall sentiment remains bearish. Volume analysis shows increased selling pressure, indicating caution.
Confidence Level
Potential Risks
Unforeseen macroeconomic events or earnings reports could lead to further declines. Watch for resistance at 365.
1 Month Prediction
Target: May 10, 2025$370
$365
$375
$360
Description
A gradual recovery is expected as the stock may stabilize around 360-370. The MACD shows signs of potential bullish divergence, but caution is warranted due to overall market sentiment.
Analysis
MSFT has faced significant selling pressure, with a bearish trend dominating. Key support levels are being tested, and while a recovery is possible, the overall sentiment remains cautious. Technical indicators suggest potential for a bounce.
Confidence Level
Potential Risks
Market conditions and external factors could hinder recovery. A failure to break above 375 may lead to further declines.
3 Months Prediction
Target: July 10, 2025$380
$375
$390
$370
Description
If the market stabilizes, a gradual recovery to 380 is possible. The stock may find support at 370, but bearish sentiment could limit upside potential. Watch for macroeconomic influences.
Analysis
The stock has been under pressure, with significant resistance at 390. While a recovery is possible, the overall trend remains bearish. Technical indicators suggest caution, and external factors could heavily influence performance.
Confidence Level
Potential Risks
Long-term predictions are uncertain due to potential market volatility and economic conditions. A bearish trend could persist if negative news arises.