MSFT Trading Predictions
1 Day Prediction
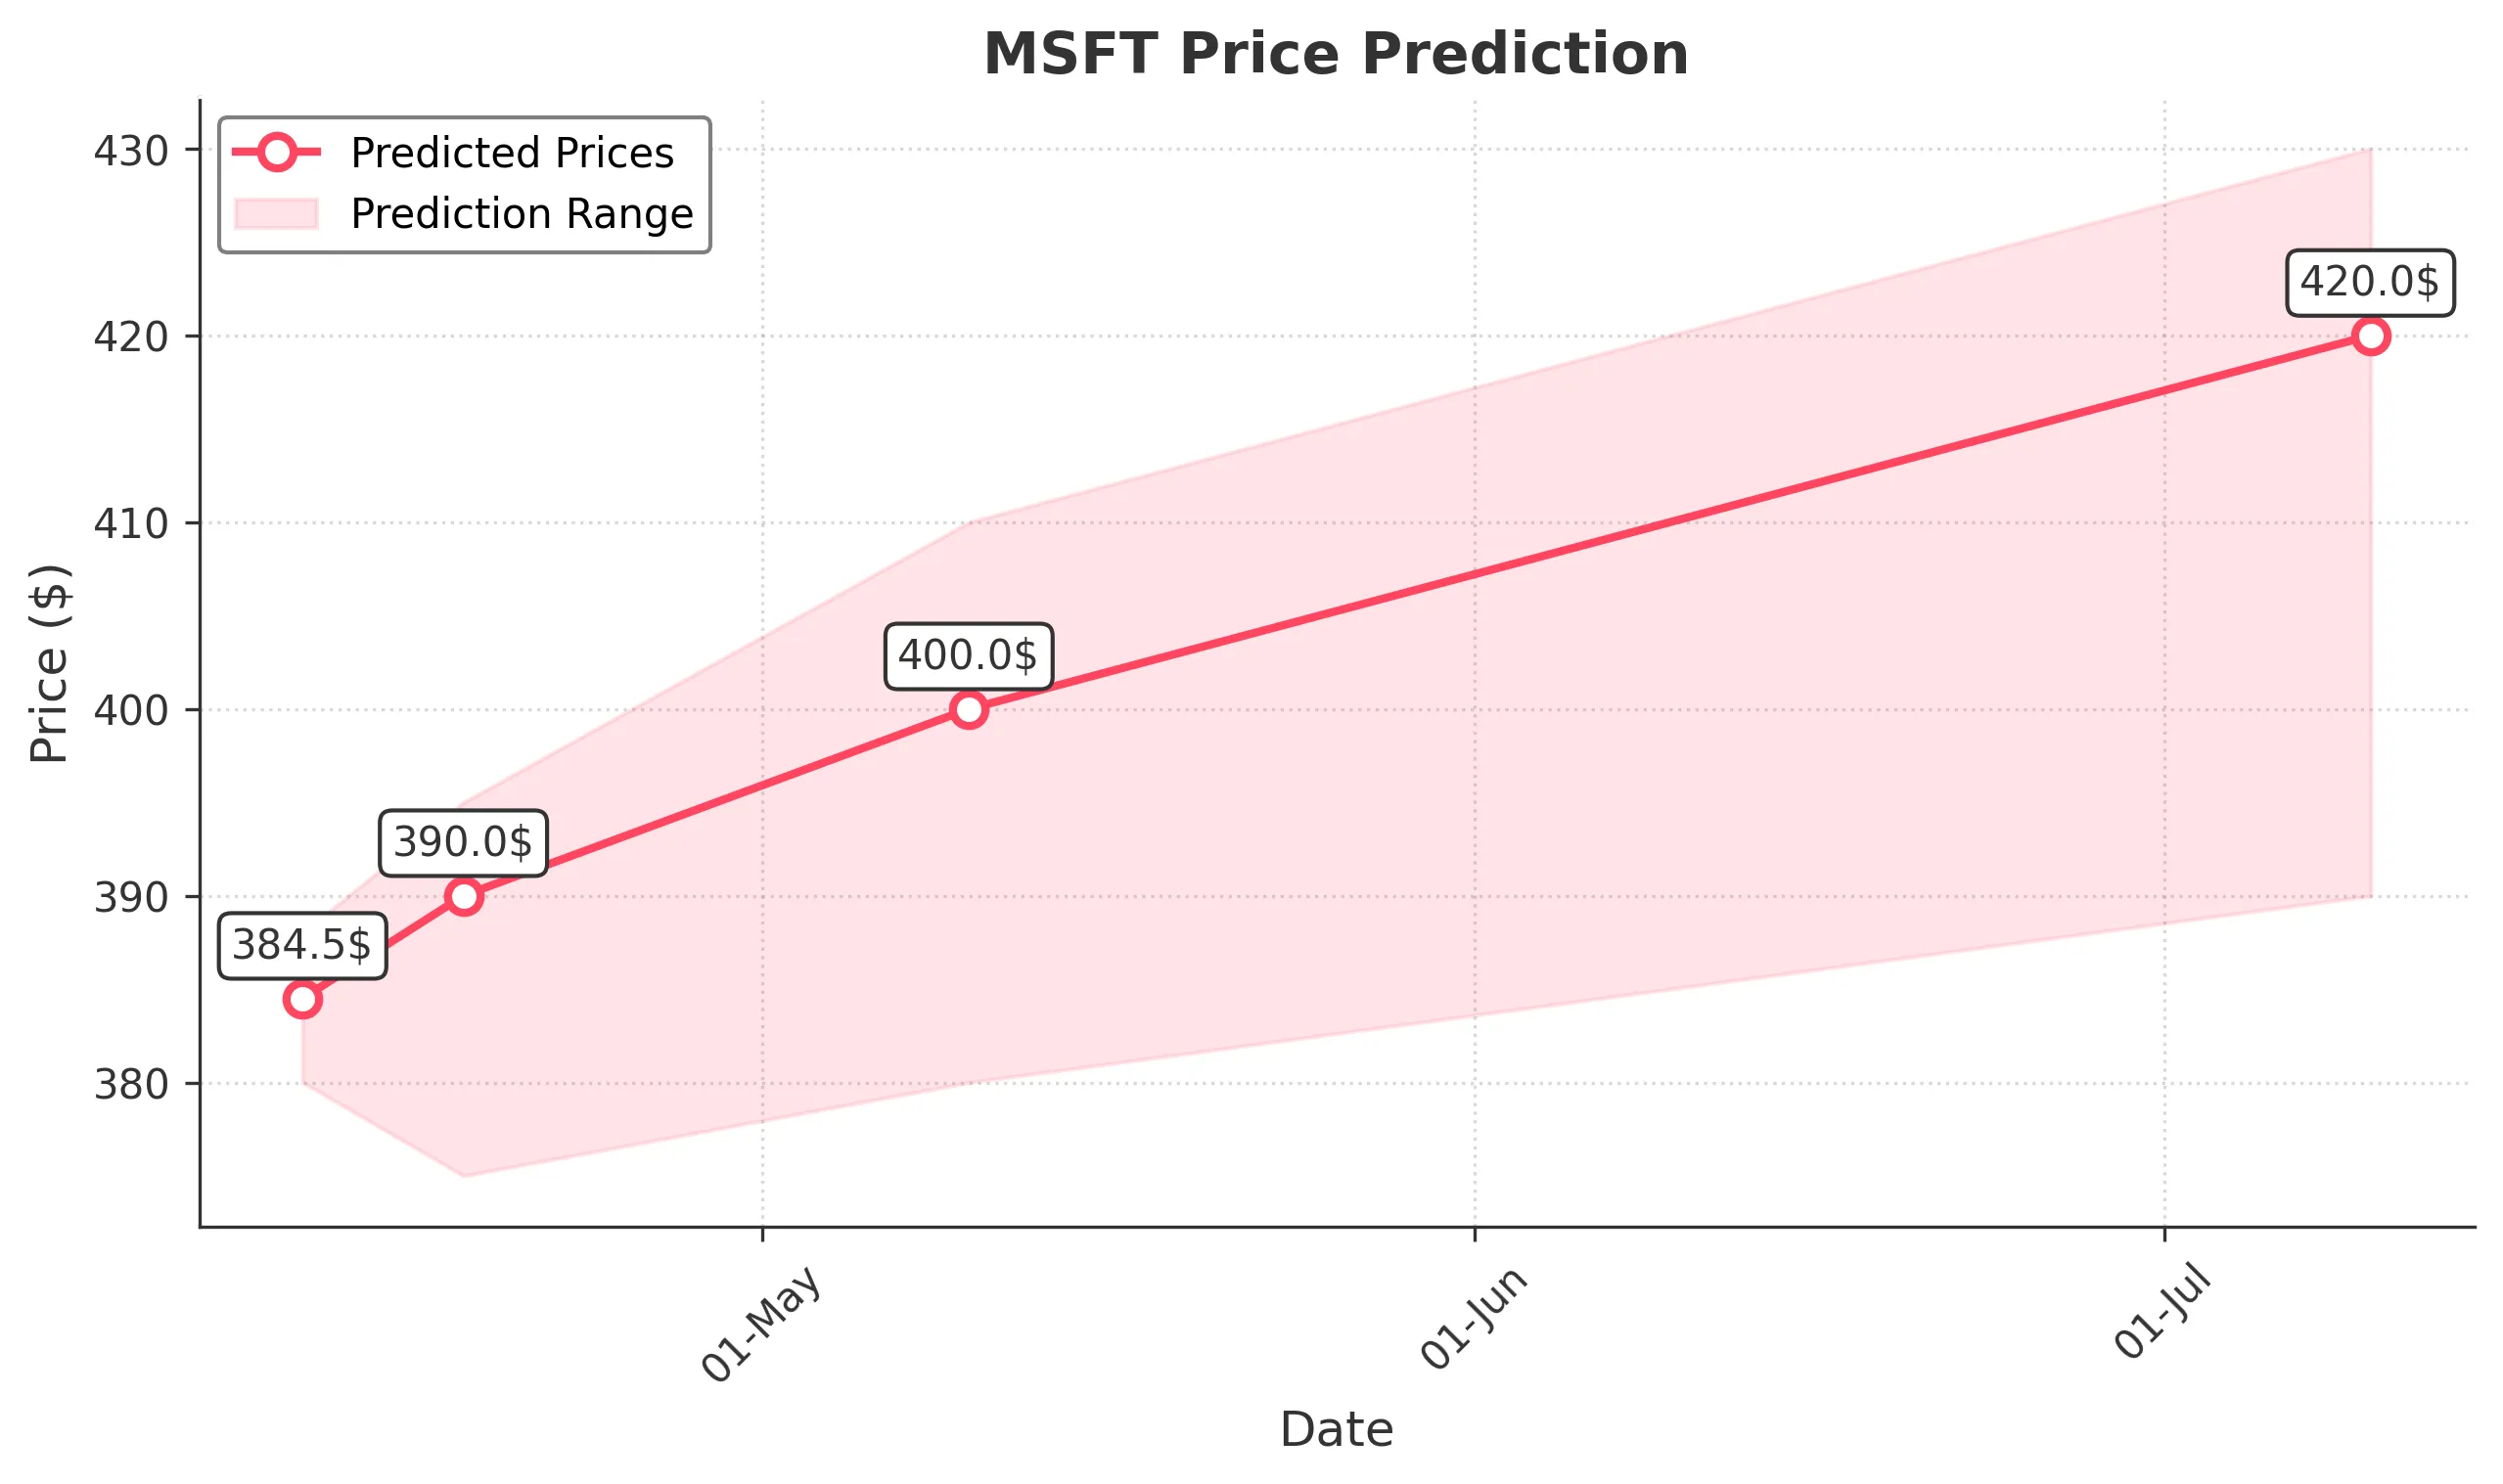
Target: April 11, 2025$384.5
$382.6
$388
$380
Description
The stock shows a slight bullish trend with a potential recovery after recent declines. The RSI is near 40, indicating potential upward momentum. However, the MACD is bearish, suggesting caution. Volume is expected to be moderate as traders react to recent price action.
Analysis
Over the past 3 months, MSFT has experienced significant volatility, with a bearish trend recently. Key support is around $350, while resistance is near $400. The MACD indicates bearish momentum, but recent candlestick patterns suggest potential for a short-term bounce.
Confidence Level
Potential Risks
Market volatility and external news could impact the prediction. A sudden downturn is possible if selling pressure increases.
1 Week Prediction
Target: April 18, 2025$390
$384.5
$395
$375
Description
A potential recovery is anticipated as the stock may find support at $375. The RSI is improving, indicating increasing buying interest. However, the MACD remains bearish, suggesting caution. Volume may increase as traders react to earnings reports.
Analysis
MSFT has shown a bearish trend recently, with significant price fluctuations. Support at $375 and resistance at $400 are critical levels. The ATR indicates high volatility, and recent volume spikes suggest active trading, which could lead to further price swings.
Confidence Level
Potential Risks
Unforeseen macroeconomic events or earnings surprises could lead to increased volatility, impacting the accuracy of this prediction.
1 Month Prediction
Target: May 10, 2025$400
$390
$410
$380
Description
The stock is expected to recover towards $400 as bullish sentiment may return. The RSI is approaching neutral territory, and the MACD may cross bullish. However, resistance at $410 could limit gains. Volume is likely to remain elevated as traders react to market conditions.
Analysis
MSFT has been in a bearish phase, but signs of recovery are emerging. Key support at $375 and resistance at $410 are crucial. The Bollinger Bands indicate potential for a breakout, while the MACD shows signs of bullish divergence, suggesting a possible trend reversal.
Confidence Level
Potential Risks
Market sentiment can shift quickly, and external factors such as economic data releases could impact the stock's trajectory.
3 Months Prediction
Target: July 10, 2025$420
$400
$430
$390
Description
A bullish trend is anticipated as the stock may recover to $420. The RSI is expected to improve, indicating stronger buying pressure. The MACD may turn bullish, supporting upward momentum. However, resistance at $430 could pose challenges.
Analysis
MSFT has faced significant volatility, with a bearish trend recently. Key support at $375 and resistance at $430 are critical. The stock's performance will depend on broader market trends and macroeconomic factors, with potential for recovery if bullish sentiment prevails.
Confidence Level
Potential Risks
Economic conditions and market sentiment could change, leading to unexpected price movements. A bearish reversal is still a possibility.