MSFT Trading Predictions
1 Day Prediction
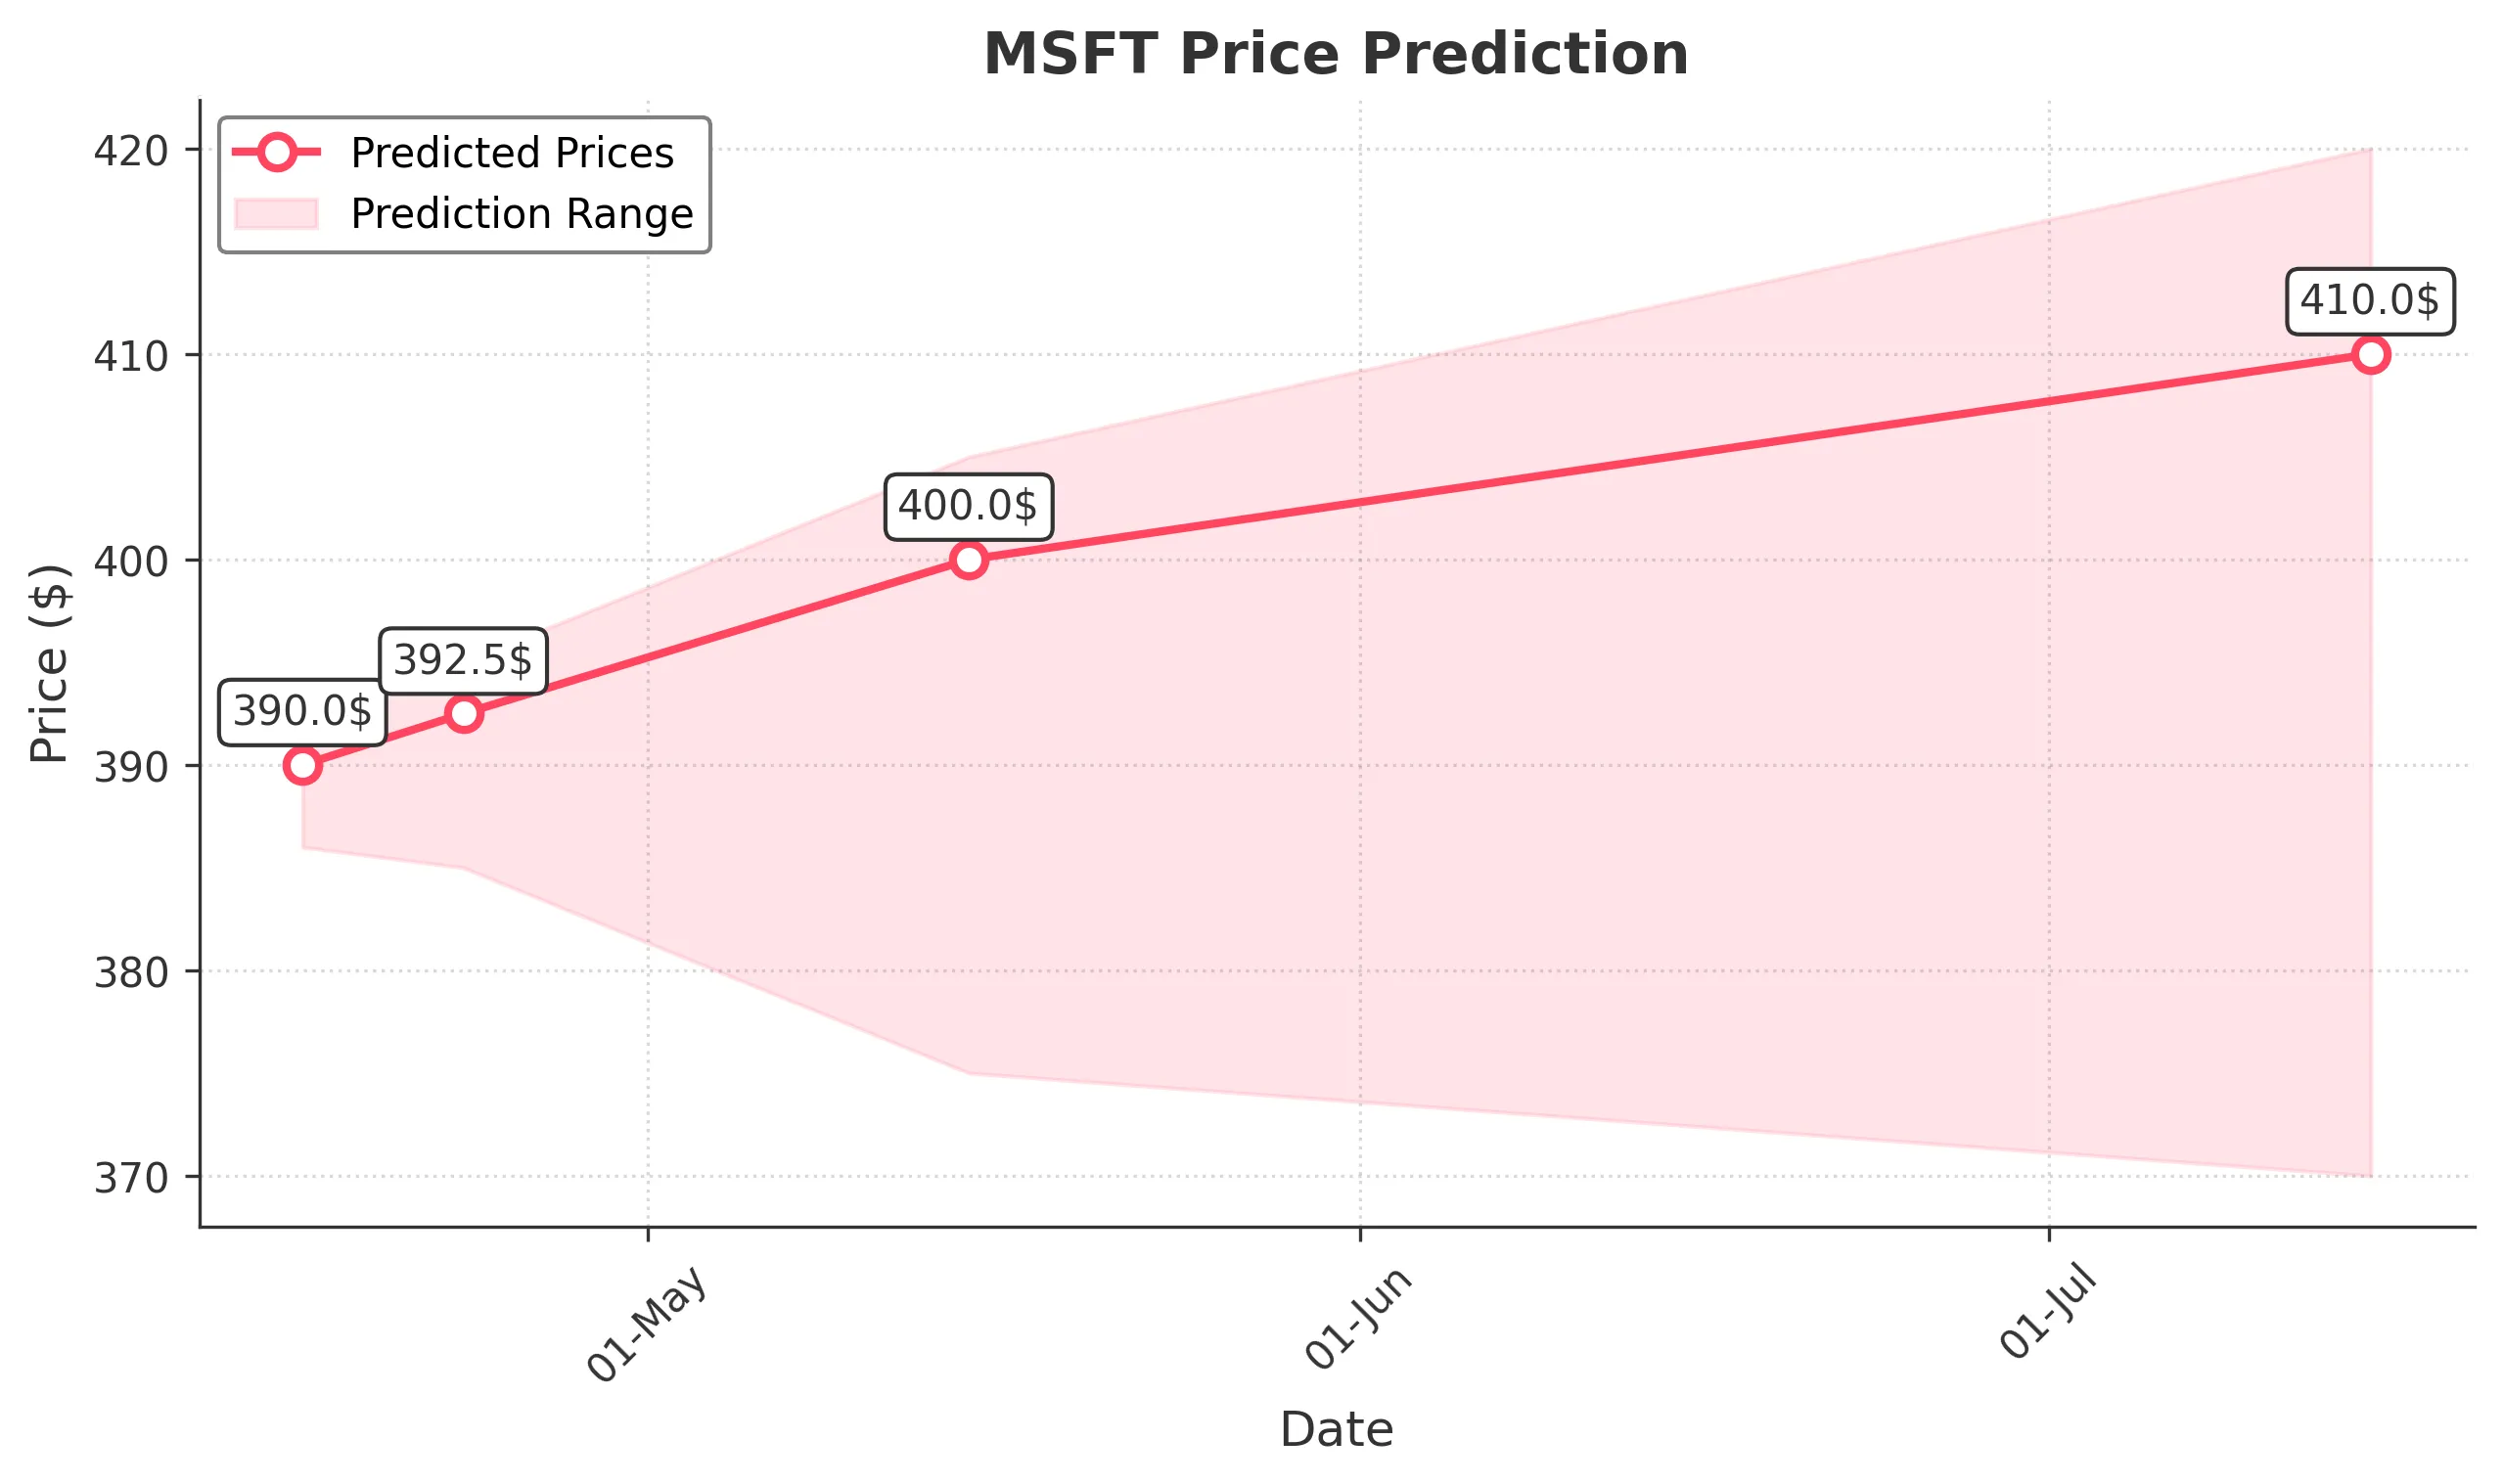
Target: April 16, 2025$390
$389
$392
$386
Description
The stock shows a slight bullish trend with a recent Doji pattern indicating indecision. RSI is neutral, and MACD is close to crossing above the signal line, suggesting potential upward momentum. However, recent volatility may lead to fluctuations.
Analysis
Over the past 3 months, MSFT has shown a bearish trend with significant volatility. Key support at 375 and resistance at 400. Recent volume spikes indicate increased interest, but the overall trend remains cautious.
Confidence Level
Potential Risks
Market sentiment could shift due to macroeconomic news or earnings reports, which may impact the stock's performance.
1 Week Prediction
Target: April 23, 2025$392.5
$390
$395
$385
Description
The stock may experience a slight recovery as it approaches the Fibonacci retracement level of 38.2%. The MACD shows potential bullish divergence, but the RSI indicates overbought conditions, suggesting caution.
Analysis
MSFT has been in a bearish phase, with significant resistance at 400. The recent price action shows a struggle to maintain upward momentum, and external factors could influence the stock's trajectory.
Confidence Level
Potential Risks
Potential for a pullback exists if market sentiment turns negative or if earnings disappoint.
1 Month Prediction
Target: May 15, 2025$400
$395
$405
$375
Description
A potential recovery towards the 400 mark is anticipated as the stock approaches key support levels. The Bollinger Bands indicate a squeeze, suggesting a breakout could occur. However, the RSI remains a concern for overbought conditions.
Analysis
The stock has shown a bearish trend with significant fluctuations. Key support at 375 and resistance at 400. Volume patterns indicate increased trading activity, but overall market sentiment remains cautious.
Confidence Level
Potential Risks
Market volatility and external economic factors could lead to unexpected price movements.
3 Months Prediction
Target: July 15, 2025$410
$405
$420
$370
Description
A gradual recovery is expected as the stock stabilizes above key support levels. The MACD may indicate a bullish crossover, and the RSI could normalize. However, macroeconomic conditions will play a crucial role in the stock's performance.
Analysis
MSFT has faced a bearish trend with high volatility. Key support at 375 and resistance at 400. The stock's performance will depend on broader market conditions and investor sentiment in the coming months.
Confidence Level
Potential Risks
Unforeseen economic events or earnings results could impact the stock's trajectory significantly.