MSFT Trading Predictions
1 Day Prediction
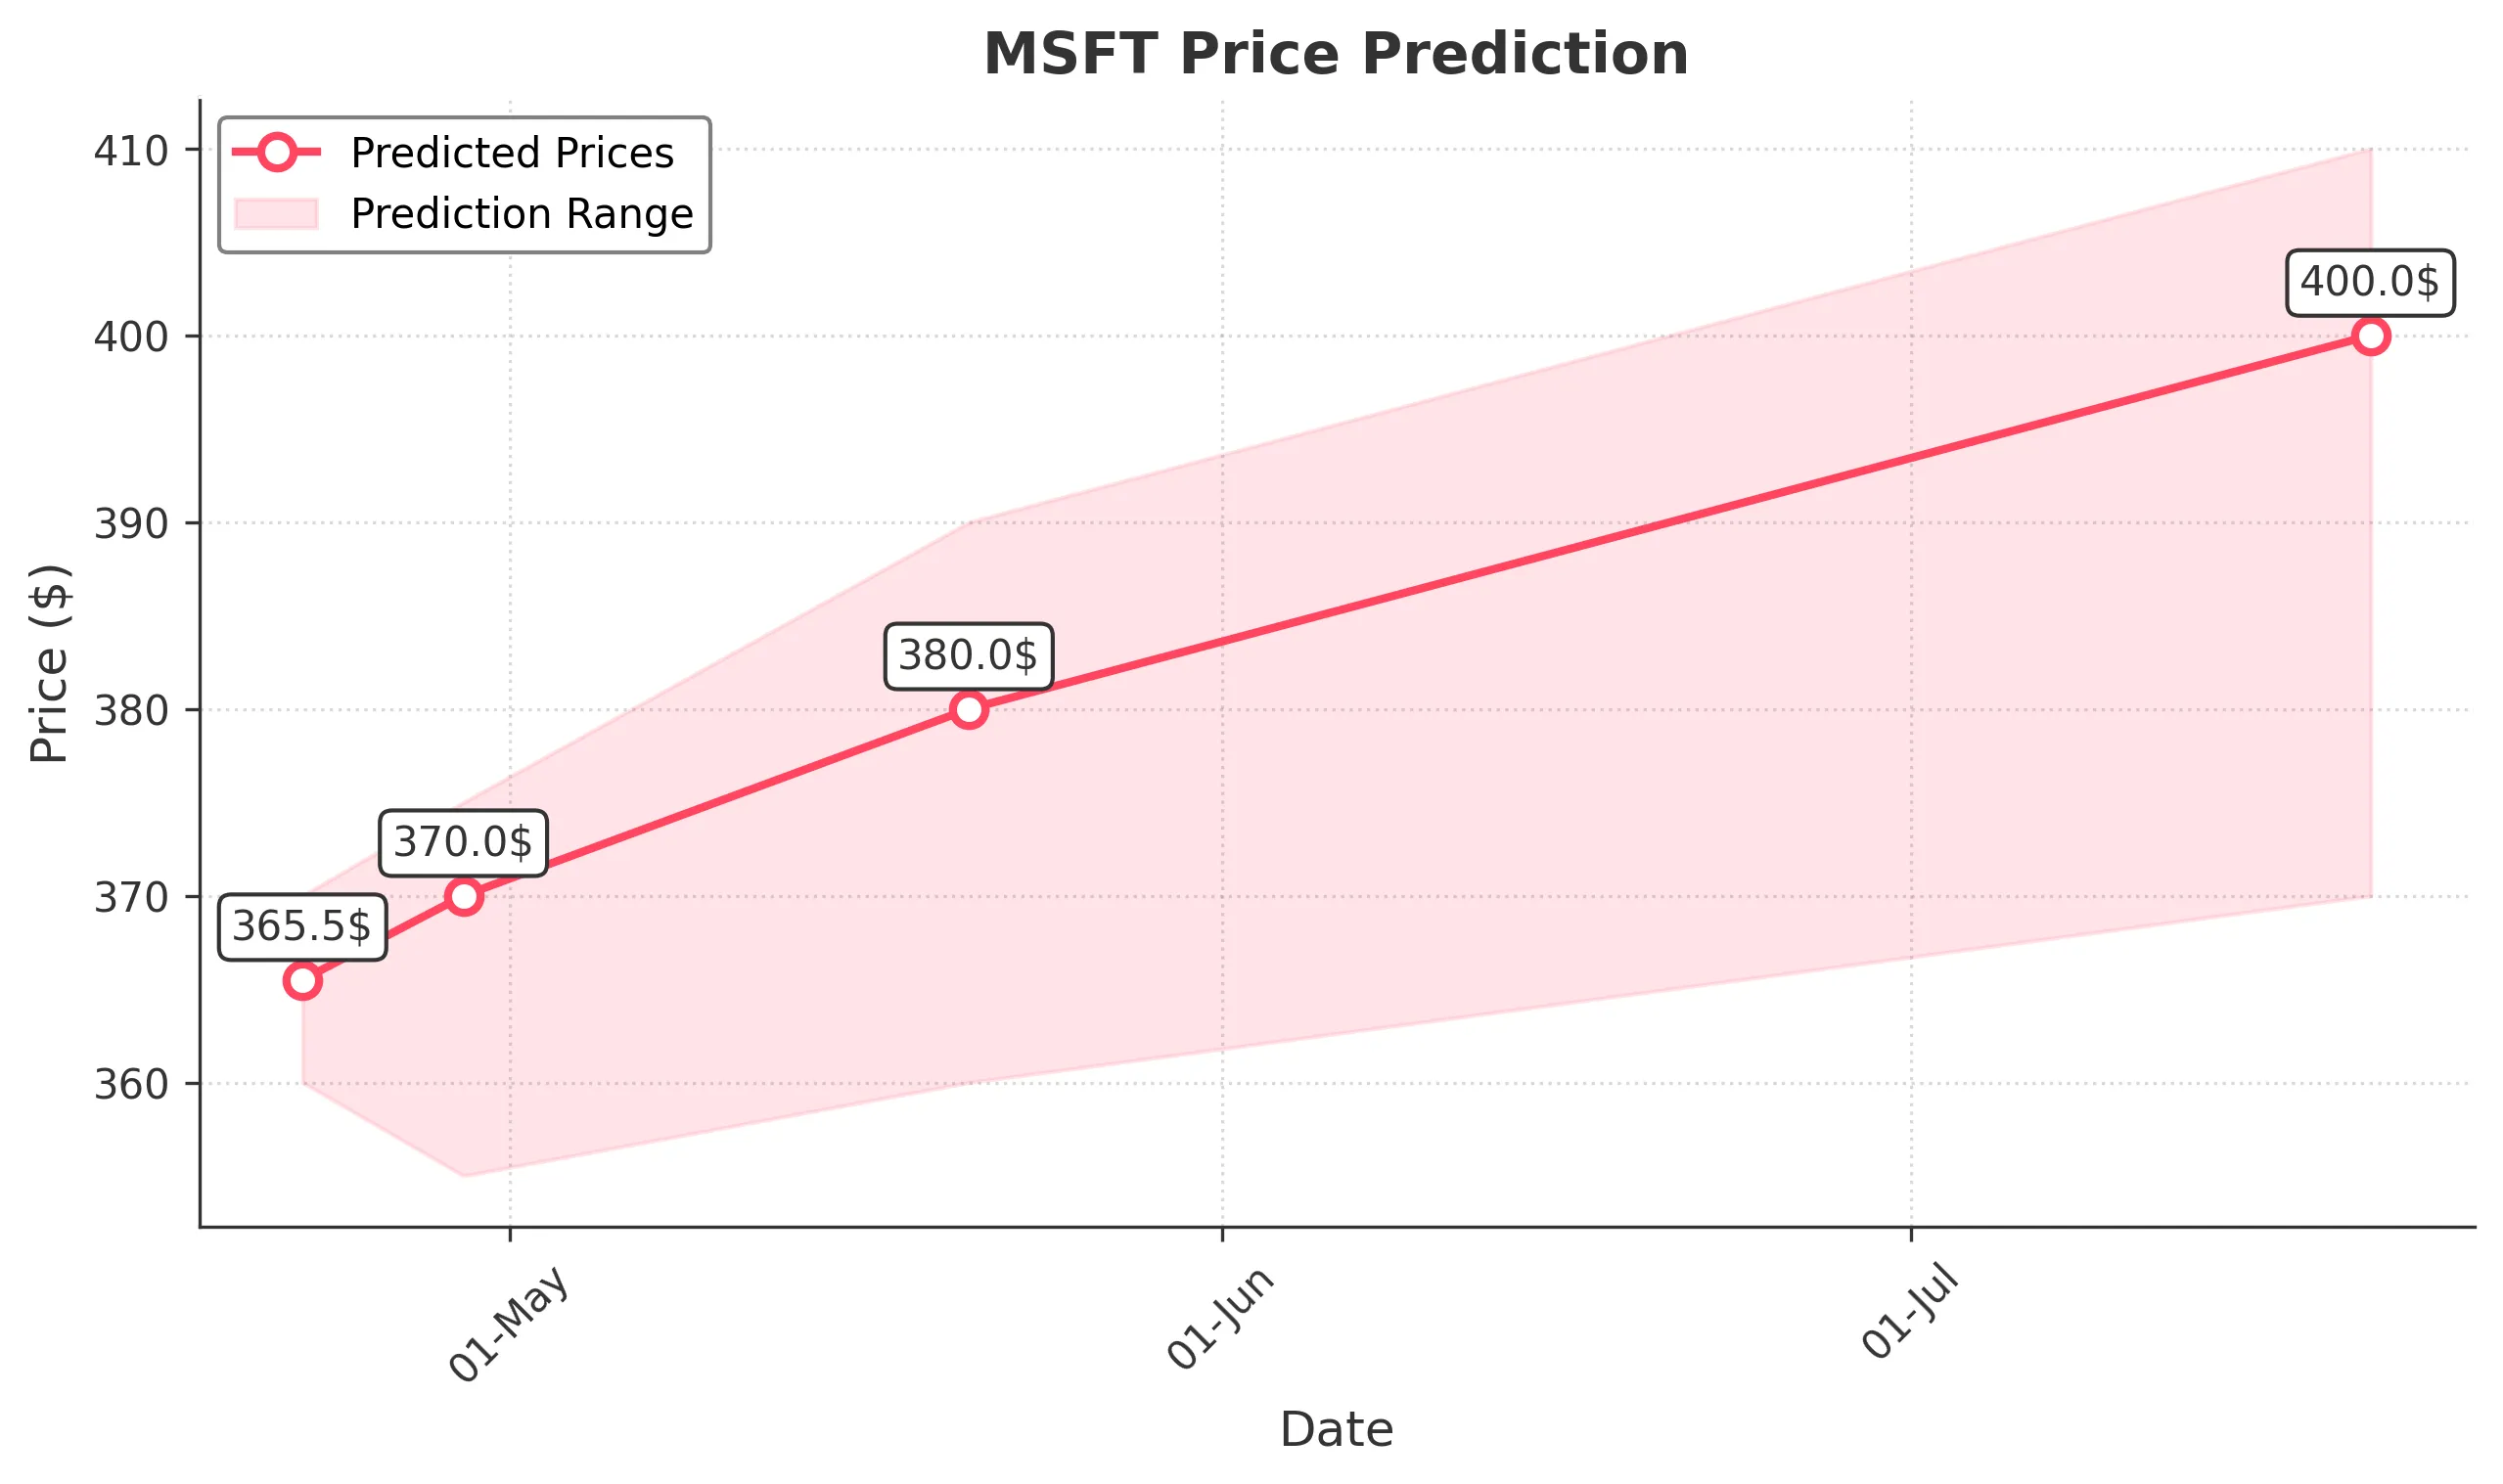
Target: April 22, 2025$365.5
$364
$370
$360
Description
The stock shows a slight bullish trend with a potential recovery from recent lows. RSI indicates oversold conditions, while MACD is showing a bullish crossover. However, volatility remains high, suggesting caution.
Analysis
Over the past 3 months, MSFT has experienced significant volatility, with a bearish trend recently. Key support at 360.00 and resistance at 380.00. RSI indicates oversold conditions, while MACD shows potential bullish signals. Volume spikes suggest increased interest, but overall sentiment remains cautious.
Confidence Level
Potential Risks
Market sentiment is mixed, and external factors could lead to sudden price changes. A bearish reversal is possible if selling pressure increases.
1 Week Prediction
Target: April 29, 2025$370
$365.5
$375
$355
Description
A potential recovery is expected as the stock approaches key resistance levels. The recent bullish candlestick patterns suggest a reversal, but market volatility could impact performance.
Analysis
MSFT has shown a bearish trend recently, with significant price drops. Key support at 355.00 and resistance at 375.00. Technical indicators suggest a possible reversal, but overall market sentiment remains cautious. Volume analysis indicates increased trading activity, which could signal a shift.
Confidence Level
Potential Risks
Uncertainty in macroeconomic conditions and potential earnings reports could lead to unexpected price movements. Watch for volume trends.
1 Month Prediction
Target: May 21, 2025$380
$370
$390
$360
Description
If the bullish momentum continues, MSFT could reach 380.00, supported by positive market sentiment and potential recovery patterns. However, resistance at 390.00 may limit gains.
Analysis
The stock has been in a bearish phase, with significant fluctuations. Key support at 360.00 and resistance at 390.00. Technical indicators show mixed signals, with potential for recovery but also risks of further declines. Volume patterns indicate increased interest, but caution is advised.
Confidence Level
Potential Risks
Market volatility and external economic factors could hinder recovery. A bearish trend could resume if selling pressure increases.
3 Months Prediction
Target: July 21, 2025$400
$385
$410
$370
Description
If the market stabilizes and positive sentiment prevails, MSFT could reach 400.00. However, external economic factors and market volatility could pose risks.
Analysis
MSFT has faced significant challenges over the past 3 months, with a bearish trend. Key support at 370.00 and resistance at 410.00. Technical indicators show potential for recovery, but risks remain high. Volume analysis indicates fluctuating interest, suggesting uncertainty in future performance.
Confidence Level
Potential Risks
Potential economic downturns or negative news could lead to price declines. Watch for changes in market sentiment and volume trends.