MSFT Trading Predictions
1 Day Prediction
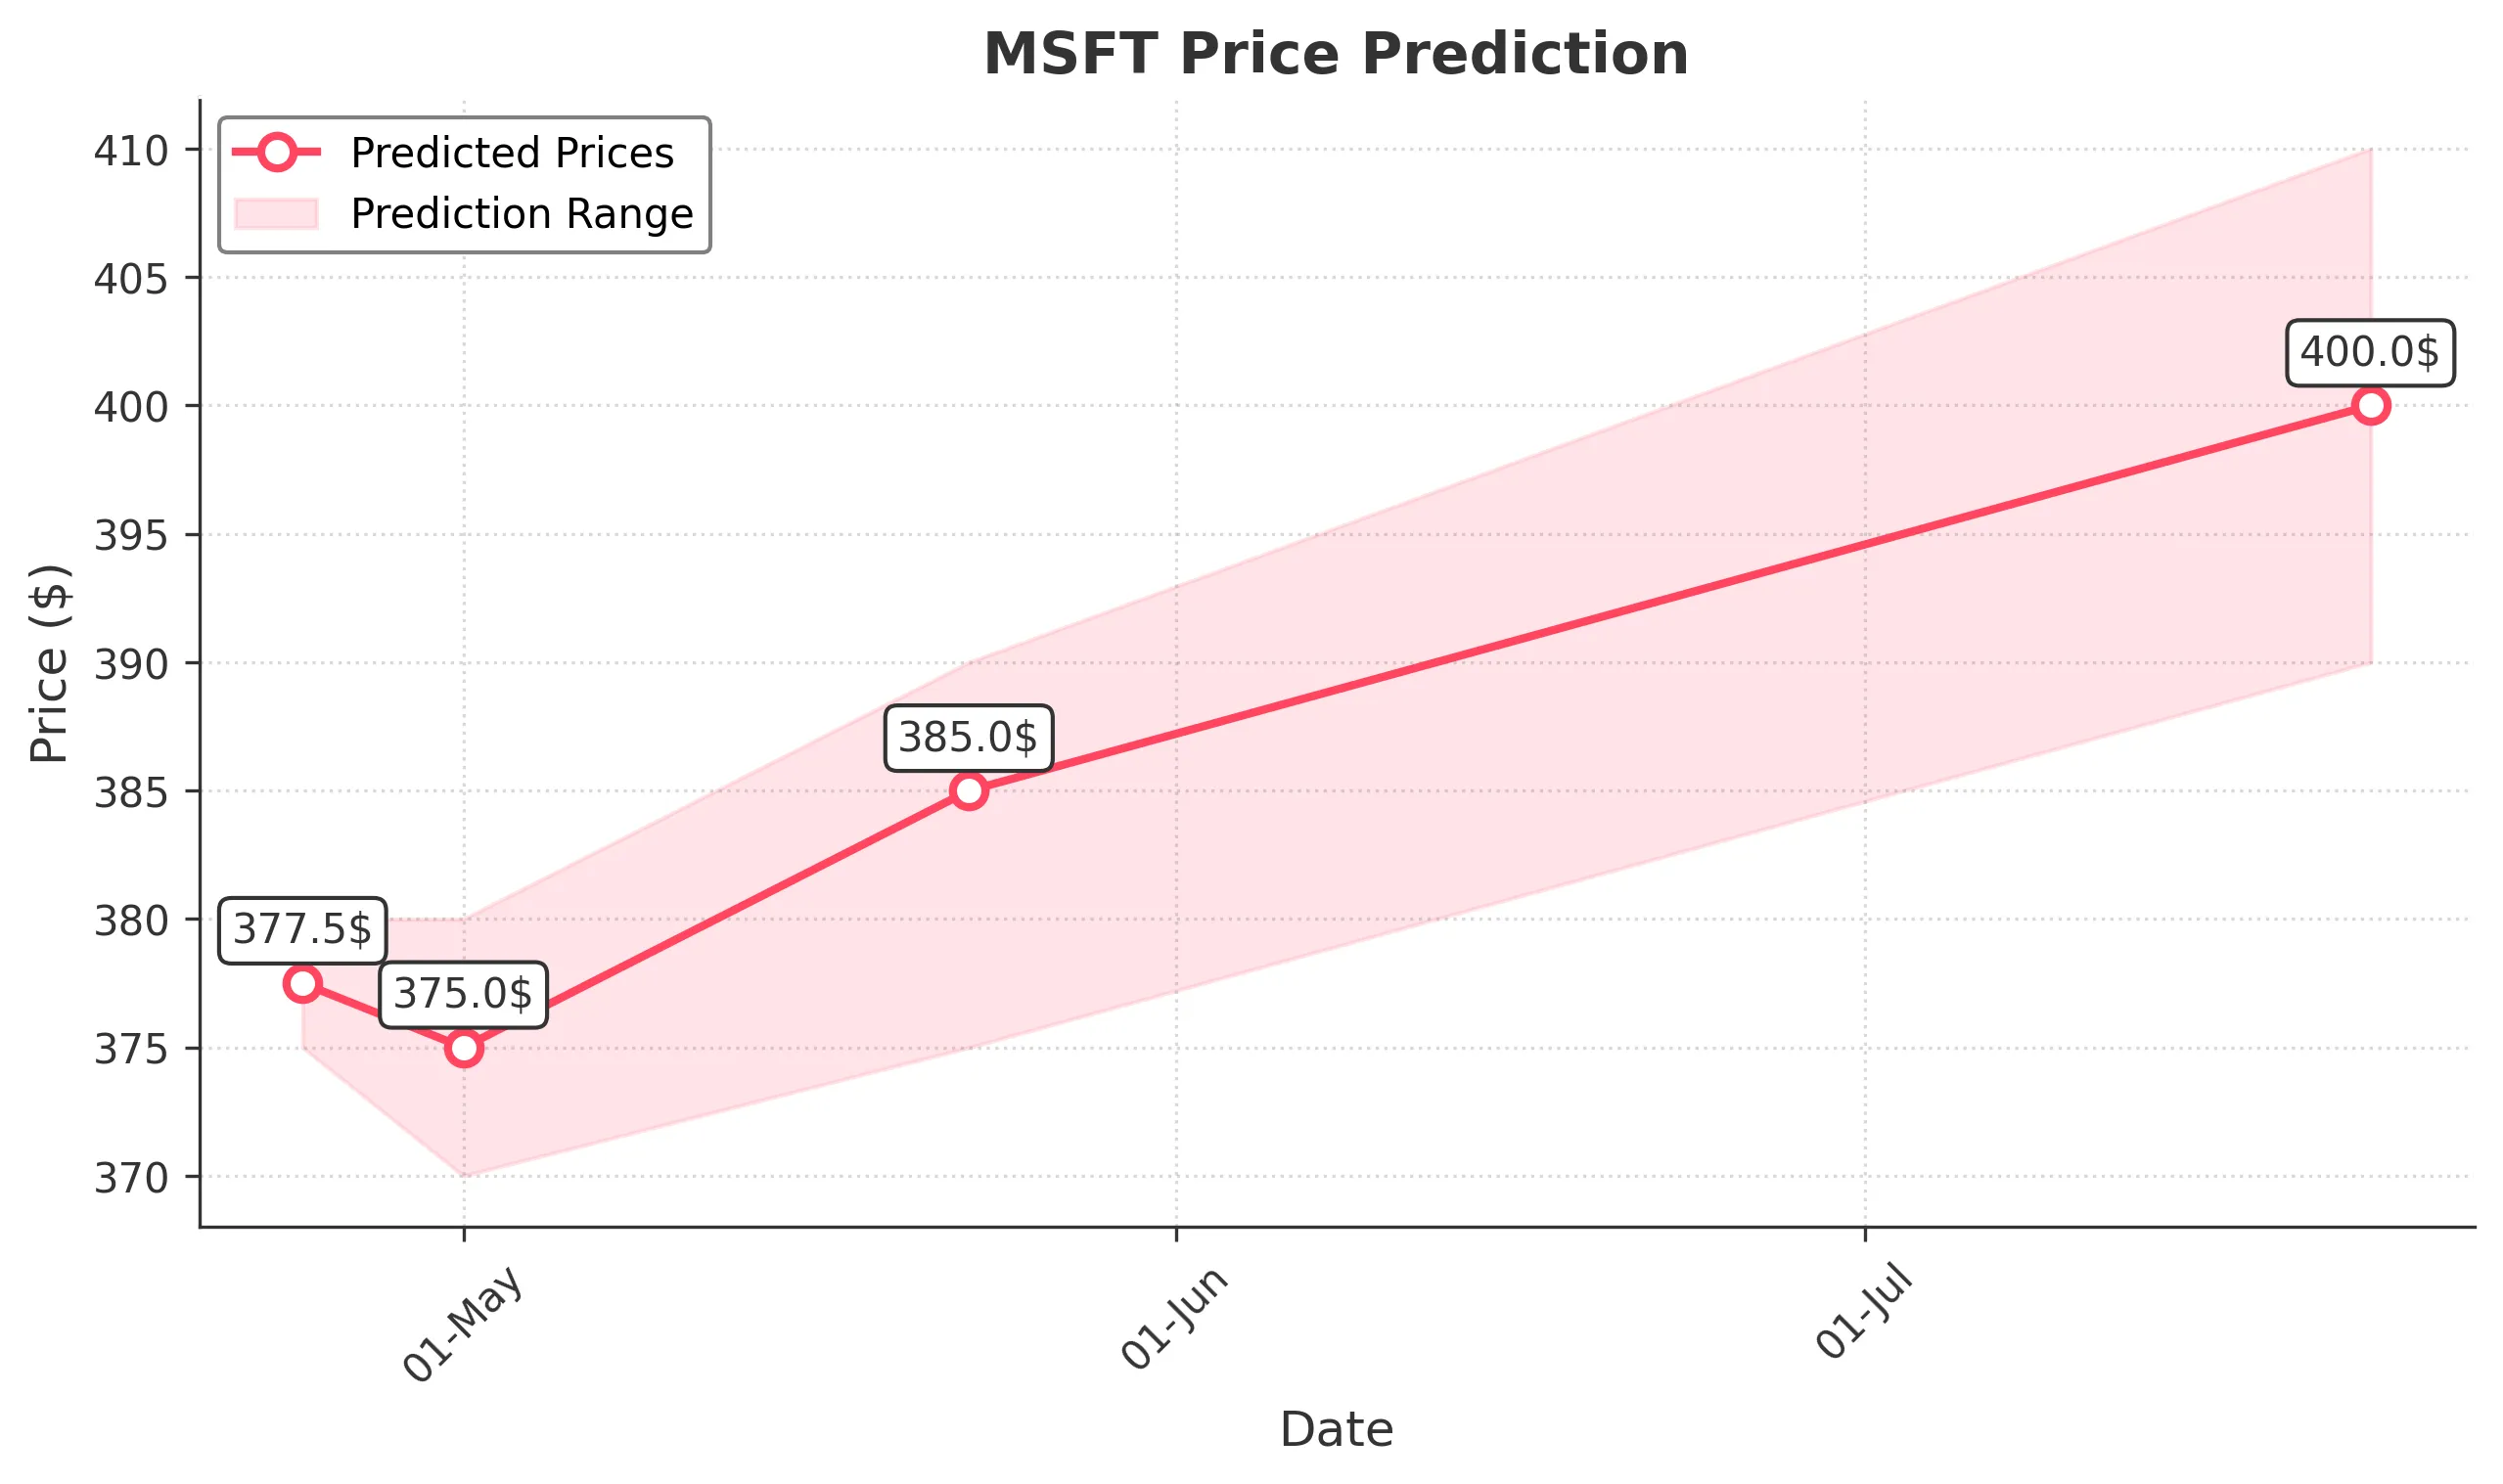
Target: April 24, 2025$377.5
$376
$380
$375
Description
The stock shows a slight bearish trend with recent lower highs and lows. RSI indicates oversold conditions, suggesting a potential bounce. However, MACD is bearish, and volume is declining, indicating caution.
Analysis
Over the past 3 months, MSFT has shown a bearish trend with significant support around $360. Technical indicators like MACD and RSI suggest weakness, while volume spikes indicate selling pressure. Recent candlestick patterns show indecision, reflecting market uncertainty.
Confidence Level
Potential Risks
Market volatility and external news could impact the prediction. A reversal is possible if bullish sentiment returns.
1 Week Prediction
Target: May 1, 2025$375
$376.5
$380
$370
Description
The bearish trend may continue, but a potential short-term recovery could occur if support holds. Watch for volume spikes that could indicate a reversal. The market sentiment remains cautious.
Analysis
MSFT has been in a downtrend, with key support at $360. Technical indicators show bearish momentum, but oversold conditions may lead to a short-term bounce. Volume analysis indicates selling pressure, and market sentiment is mixed.
Confidence Level
Potential Risks
Unforeseen macroeconomic events or earnings reports could lead to volatility, impacting the accuracy of this prediction.
1 Month Prediction
Target: May 23, 2025$385
$380
$390
$375
Description
If the stock can stabilize and break above resistance at $380, a recovery towards $385 is possible. Watch for bullish signals in RSI and MACD. However, the overall trend remains bearish.
Analysis
The stock has been under pressure, with significant resistance at $380. Technical indicators suggest potential for a recovery if bullish momentum builds. Volume patterns indicate selling pressure, and market sentiment remains cautious.
Confidence Level
Potential Risks
Continued bearish sentiment and macroeconomic factors could hinder recovery. A failure to break resistance may lead to further declines.
3 Months Prediction
Target: July 23, 2025$400
$395
$410
$390
Description
If the stock can break through key resistance levels, a gradual recovery towards $400 is feasible. However, macroeconomic conditions and earnings reports will play a crucial role in this timeframe.
Analysis
MSFT's performance has been bearish, with significant resistance at $380. Technical indicators suggest potential for recovery, but macroeconomic factors and market sentiment remain uncertain. Volume analysis indicates selling pressure, and caution is advised.
Confidence Level
Potential Risks
Market volatility and external economic factors could significantly impact the stock's performance. A bearish trend could persist if conditions do not improve.