MSFT Trading Predictions
1 Day Prediction
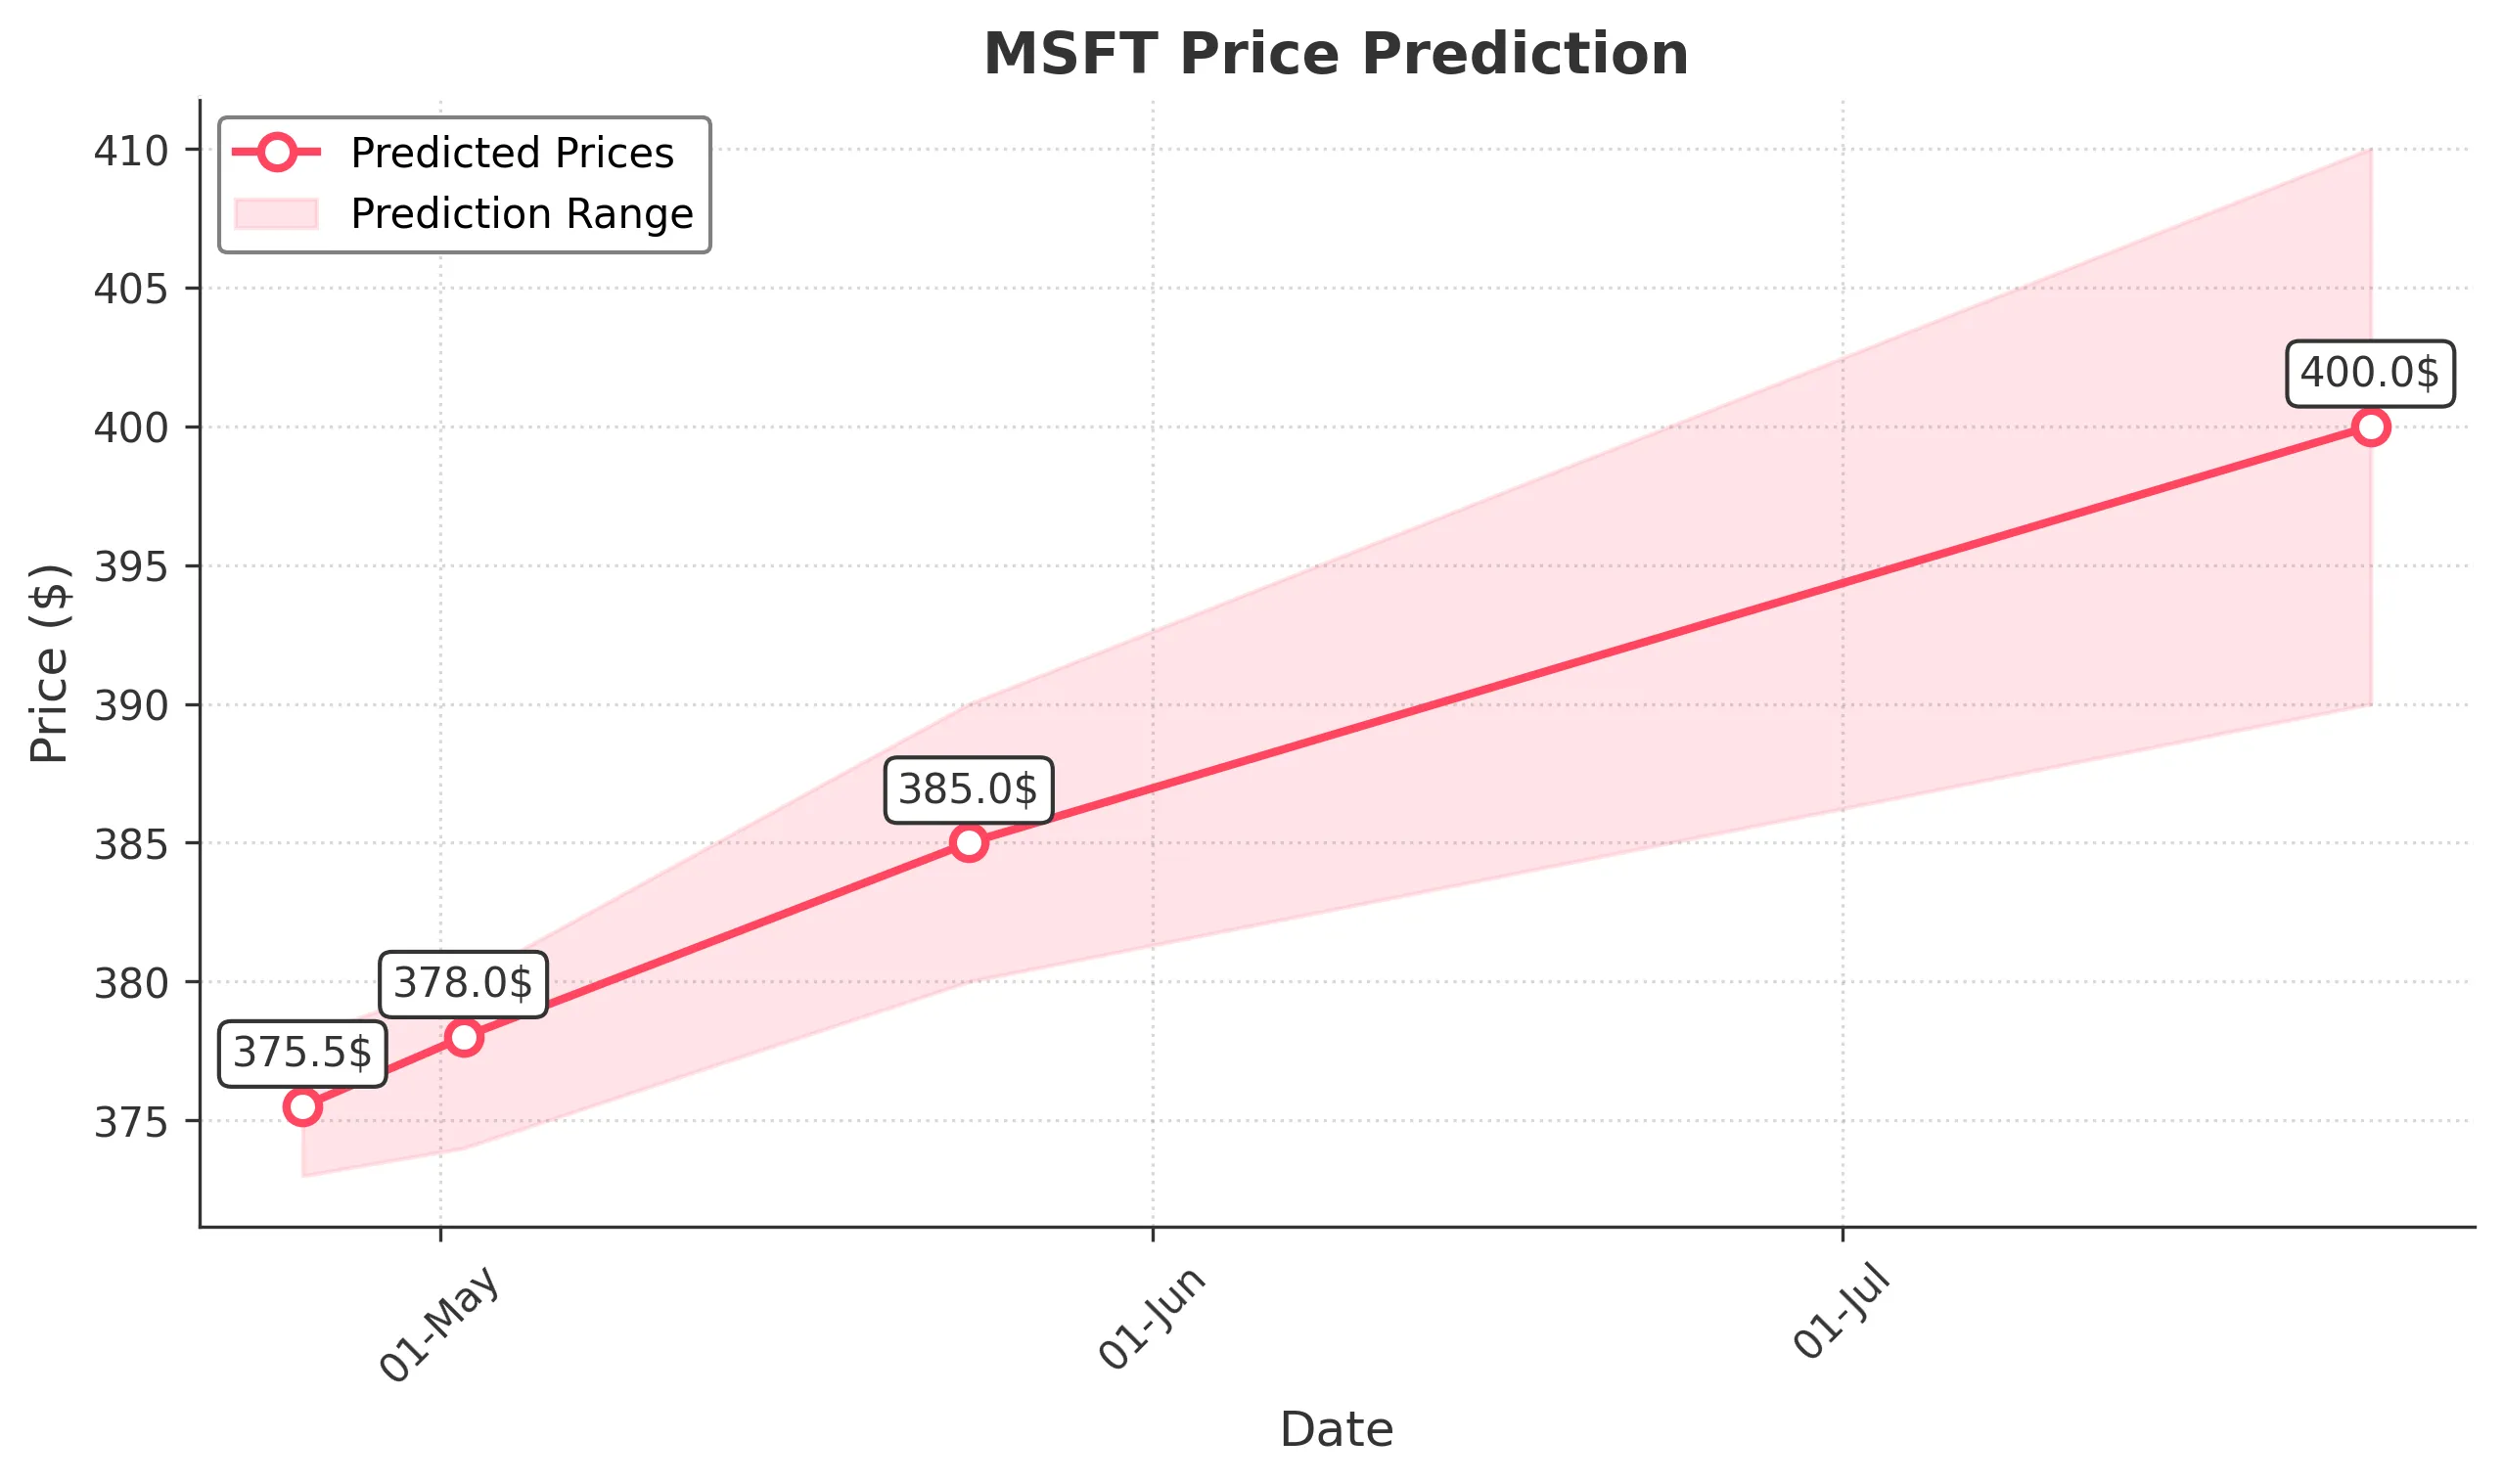
Target: April 25, 2025$375.5
$376
$378
$373
Description
The stock shows a slight bearish trend with recent lower highs and lows. RSI indicates oversold conditions, suggesting a potential bounce. However, MACD is bearish, indicating continued downward pressure. Volume spikes may indicate selling interest.
Analysis
Over the past 3 months, MSFT has shown a bearish trend with significant support around $375. Technical indicators like the MACD and RSI suggest potential for a short-term bounce, but overall sentiment remains cautious. Volume has been inconsistent, indicating uncertainty.
Confidence Level
Potential Risks
Market volatility and external news could impact the prediction. A reversal pattern could emerge if bullish sentiment returns.
1 Week Prediction
Target: May 2, 2025$378
$376.5
$380
$374
Description
The stock may experience a slight recovery as it approaches key support levels. The RSI is improving, indicating potential bullish momentum. However, MACD remains bearish, suggesting caution. Volume trends will be crucial to confirm any upward movement.
Analysis
MSFT has been in a bearish phase, with key support around $375. Recent candlestick patterns show indecision, and while there are signs of potential recovery, the overall trend remains weak. External factors could heavily influence price action.
Confidence Level
Potential Risks
Unforeseen macroeconomic events or earnings reports could lead to volatility. The bearish MACD signal raises concerns about sustainability of any upward movement.
1 Month Prediction
Target: May 24, 2025$385
$382
$390
$380
Description
A potential recovery could materialize as the stock approaches historical support levels. The RSI may stabilize, and if bullish sentiment returns, we could see a test of resistance at $390. However, bearish MACD signals remain a concern.
Analysis
The past three months have shown a bearish trend with significant resistance at $390. While there are signs of potential recovery, the overall market sentiment remains cautious. Volume patterns indicate uncertainty, and external factors could heavily influence future performance.
Confidence Level
Potential Risks
Market sentiment is fragile, and any negative news could reverse the trend. The bearish MACD indicates that upward momentum may not be sustained.
3 Months Prediction
Target: July 24, 2025$400
$395
$410
$390
Description
If the stock can break through resistance levels, a gradual recovery towards $400 is possible. The RSI may improve, indicating bullish momentum. However, macroeconomic factors and earnings reports could impact this trajectory.
Analysis
MSFT has faced significant downward pressure over the last three months, with key resistance at $400. While there are signs of potential recovery, the overall trend remains bearish. Volume patterns suggest uncertainty, and external factors could heavily influence future performance.
Confidence Level
Potential Risks
The potential for market corrections and external economic factors could hinder recovery. The bearish trend in the short term raises concerns about sustainability.