MSFT Trading Predictions
1 Day Prediction
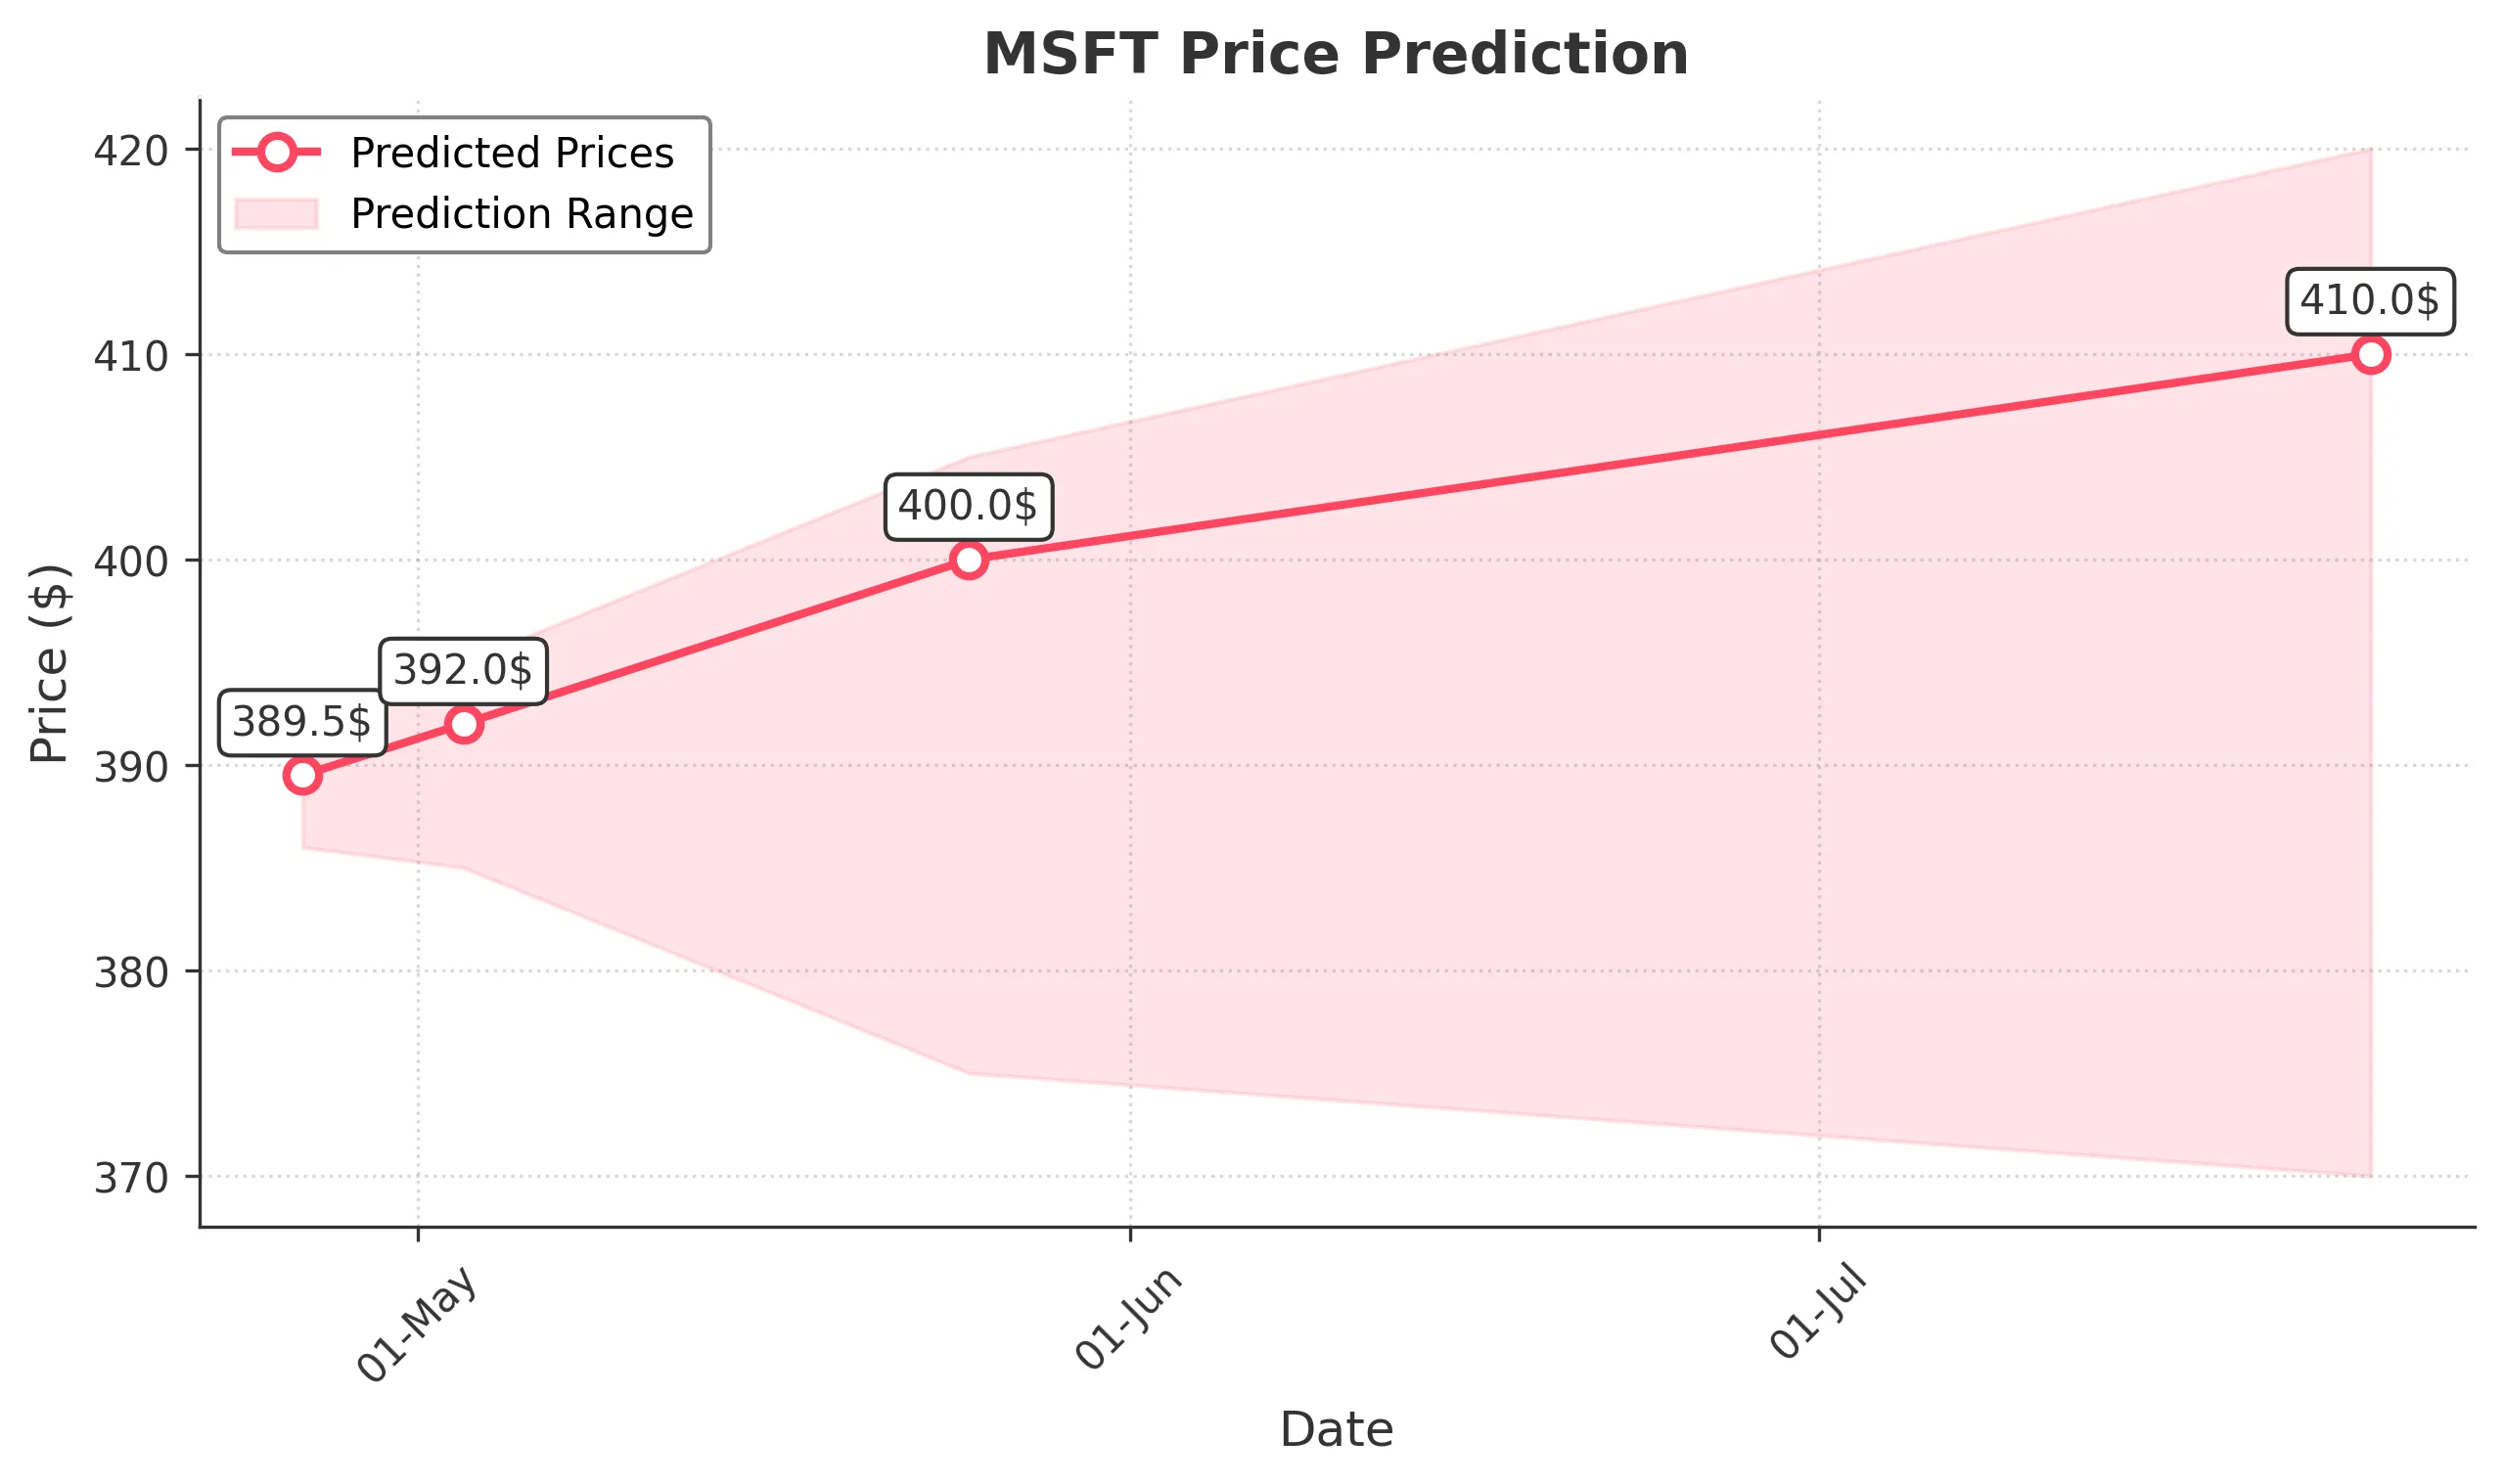
Target: April 26, 2025$389.5
$388.7
$392
$386
Description
The stock shows a slight bullish trend with a recent Doji pattern indicating indecision. RSI is near neutral, suggesting potential for upward movement. However, MACD is flattening, indicating possible resistance ahead.
Analysis
Over the past 3 months, MSFT has shown a bearish trend with significant support around $375. Recent volume spikes indicate increased interest, but the overall sentiment remains cautious. Technical indicators suggest potential for a short-term bounce, but risks of further declines exist.
Confidence Level
Potential Risks
Market volatility and external news could impact the prediction. A bearish reversal is possible if selling pressure increases.
1 Week Prediction
Target: May 3, 2025$392
$389.5
$395
$385
Description
The stock may experience a slight recovery as it approaches key Fibonacci retracement levels. However, the MACD indicates potential bearish divergence, suggesting caution. Volume trends are mixed, indicating uncertainty.
Analysis
MSFT has been in a bearish phase, with resistance at $395. The recent price action shows a struggle to maintain upward momentum. Technical indicators suggest a potential short-term recovery, but overall market sentiment remains cautious.
Confidence Level
Potential Risks
Unforeseen macroeconomic events or earnings reports could lead to volatility. The bearish divergence in MACD raises concerns about sustainability of any upward movement.
1 Month Prediction
Target: May 25, 2025$400
$392
$405
$375
Description
A potential recovery is anticipated as the stock approaches key support levels. The RSI indicates oversold conditions, which may lead to a rebound. However, the overall market sentiment remains mixed.
Analysis
The stock has shown significant volatility over the past three months, with key support at $375. While there are signs of potential recovery, the overall trend remains bearish. Technical indicators suggest a cautious approach as market sentiment fluctuates.
Confidence Level
Potential Risks
Market conditions and external factors could lead to unexpected volatility. The potential for a bearish trend reversal remains a concern.
3 Months Prediction
Target: July 25, 2025$410
$400
$420
$370
Description
Longer-term recovery is possible as the stock may find support at lower levels. The MACD could turn bullish if momentum builds. However, external economic factors could impact performance.
Analysis
MSFT's performance over the last three months has been characterized by volatility and bearish trends. Key support levels are critical, and while there are signs of potential recovery, the overall market environment remains uncertain.
Confidence Level
Potential Risks
Economic conditions, interest rates, and market sentiment could significantly affect the stock's trajectory. The potential for further declines exists if bearish sentiment prevails.